Prometheus之Exporter小结
广义上讲所有可以向Prometheus提供监控样本数据的程序都可以被称为一个Exporter。而Exporter的一个实例称为target,如下所示,Prometheus通过轮询的方式定期从这些target中获取样本数据:

一、Exporter分类
社区提供了很多要用的Exporter,这些实现能满足我们大部分的功能需求。具体可以见下表:
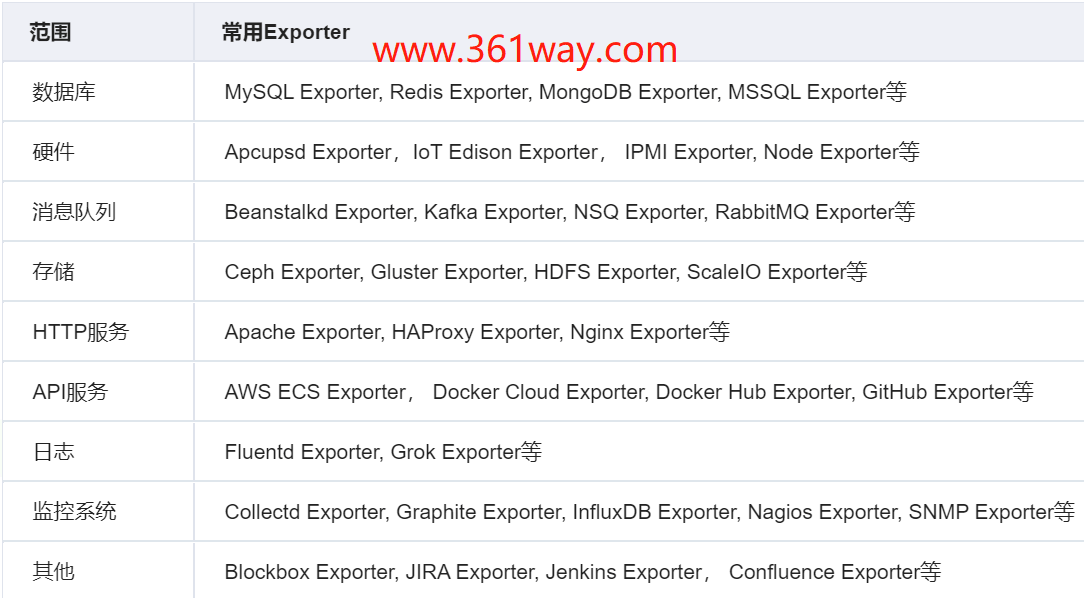
可以看出这些exporter涵盖了从基础设施,中间件以及网络等各个方面的监控功能。当然除了社区提供的exporter之外,我们也可以自定义Exporter程序,可以基于Prometheus提供的Client Library创建自己的Exporter程序,目前Promthues社区官方提供了对以下编程语言的支持:Go、Java/Scala、Python、Ruby。同时还有第三方实现的如:Bash、C++、Common Lisp、Erlang,、Haskeel、Lua、Node.js、PHP、Rust等。
二、Exporter的运行方式
Exporter的运行方式有二种类型:独立以进程的方式运行的和集成到应用中的两种。
1、独立使用的
以的Node Exporter为例,由于操作系统本身并不直接支持Prometheus,同时用户也无法通过直接从操作系统层面上提供对Prometheus的支持。因此,用户只能通过独立运行一个程序的方式,通过操作系统提供的相关接口,将系统的运行状态数据转换为可供Prometheus读取的监控数据。 除了Node Exporter以外,比如MySQL Exporter、Redis Exporter等都是通过这种方式实现的。 这些Exporter程序扮演了一个中间代理人的角色。上面表中列的都是属于这种方式。
2、集成到应用中的
为了能够更好的监控系统的内部运行状态,有些开源项目如Kubernetes,ETCD等直接在代码中使用了Prometheus的Client Library,提供了对Prometheus的直接支持。这种方式打破的监控的界限,让应用程序可以直接将内部的运行状态暴露给Prometheus,适合于一些需要更多自定义监控指标需求的项目。
三、Exporter规范
所有的Exporter程序都需要按照Prometheus的规范,返回监控的样本数据。以Node Exporter为例,当访问/metrics地址时会返回以下内容:
1# HELP node_cpu Seconds the cpus spent in each mode.
2# TYPE node_cpu counter
3node_cpu{cpu="cpu0",mode="idle"} 362812.7890625
4# HELP node_load1 1m load average.
5# TYPE node_load1 gauge
6node_load1 3.0703125
这是一种基于文本的格式规范,Exporter返回的样本数据,主要由三个部分组成:样本的一般注释信息(HELP),样本的类型注释信息(TYPE)和样本。Prometheus会对Exporter响应的内容逐行解析。
如果当前行以# HELP开始,Prometheus将会按照以下规则对内容进行解析,得到当前的指标名称以及相应的说明信息:
1# HELP <metrics_name> <doc_string>
如果当前行以# TYPE开始,Prometheus会按照以下规则对内容进行解析,得到当前的指标名称以及指标类型:
1# TYPE <metrics_name> <metrics_type>
TYPE注释行必须出现在指标的第一个样本之前。如果没有明确的指标类型需要返回为untyped。 除了# 开头的所有行都会被视为是监控样本数据。 每一行样本需要满足以下格式规范:
1metric_name [
2  "{" label_name "=" `"` label_value `"` { "," label_name "=" `"` label_value `"` } [ "," ] "}"
3] value [ timestamp ]
其中metric_name和label_name必须遵循PromQL的格式规范要求。value是一个float格式的数据,timestamp的类型为int64(从1970-01-01 00:00:00以来的毫秒数),timestamp为可选默认为当前时间。具有相同metric_name的样本必须按照一个组的形式排列,并且每一行必须是唯一的指标名称和标签键值对组合。
需要特别注意的是对于histogram和summary类型的样本。需要按照以下约定返回样本数据:
1 . 类型为summary或者histogram的指标x,该指标所有样本的值的总和需要使用一个单独的x_sum指标表示
2 . 类型为summary或者histogram的指标x,该指标所有样本的总数需要使用一个单独的x_count指标表示。
3 . 对于类型为summary的指标x,其不同分位数quantile所代表的样本,需要使用单独的x{quantile=”y”}表示。
4 . 对于类型histogram的指标x为了表示其样本的分布情况,每一个分布需要使用x_bucket{le=”y”}表示,其中y为当前分布的上位数。同时必须包含一个样本x_bucket{le=”+Inf”},并且其样本值必须和x_count相同。
5 . 对于histogram和summary的样本,必须按照分位数quantile和分布le的值的递增顺序排序。
以下是类型为histogram和summary的样本输出示例
 1# A histogram, which has a pretty complex representation in the text format:
 2# HELP http_request_duration_seconds A histogram of the request duration.
 3# TYPE http_request_duration_seconds histogram
 4http_request_duration_seconds_bucket{le="0.05"} 24054
 5http_request_duration_seconds_bucket{le="0.1"} 33444
 6http_request_duration_seconds_bucket{le="0.2"} 100392
 7http_request_duration_seconds_bucket{le="+Inf"} 144320
 8http_request_duration_seconds_sum 53423
 9http_request_duration_seconds_count 144320
10# Finally a summary, which has a complex representation, too:
11# HELP rpc_duration_seconds A summary of the RPC duration in seconds.
12# TYPE rpc_duration_seconds summary
13rpc_duration_seconds{quantile="0.01"} 3102
14rpc_duration_seconds{quantile="0.05"} 3272
15rpc_duration_seconds{quantile="0.5"} 4773
16rpc_duration_seconds_sum 1.7560473e+07
17rpc_duration_seconds_count 2693
在Exporter响应的HTTP头信息中,可以通过Content-Type指定特定的规范版本,例如:
1HTTP/1.1 200 OK
2Content-Encoding: gzip
3Content-Length: 2906
4Content-Type: text/plain; version=0.0.4
其中version用于指定Text-based的格式版本,当没有指定版本的时候,默认使用最新格式规范的版本。同时HTTP响应头还需要指定压缩格式为gzip。
捐赠本站(Donate)
 如您感觉文章有用,可扫码捐赠本站!(If the article useful, you can scan the QR code to donate))
- Author: shisekong
- Link: https://blog.361way.com/exporters/6484.html
- License: This work is under a 知识共享署名-非商业性使用-禁止演绎 4.0 国际许可协议. Kindly fulfill the requirements of the aforementioned License when adapting or creating a derivative of this work.