开源分布式时序数据库InfluxDB
在过去的很长时间个人感觉监控块使用的通用时序数据库是rrd 数据库,并且rrdtool 本身又可以方便调用rrd 数据库的数据生成图表。不过随着最几年大数据、云平台都技术的发展。又发现一个强大的时序数据库InfluxDB ,InfluxDB 是一个开源分布式时序、事件和指标数据库。使用 Go 语言编写,无需外部依赖。其设计目标是实现分布式和水平伸缩扩展。
特点
- schemaless(无结构),可以是任意数量的列
- Scalable
- min, max, sum, count, mean, median 一系列函数,方便统计
- Native HTTP API, 内置http支持,使用http读写
- Powerful Query Language 类似sql
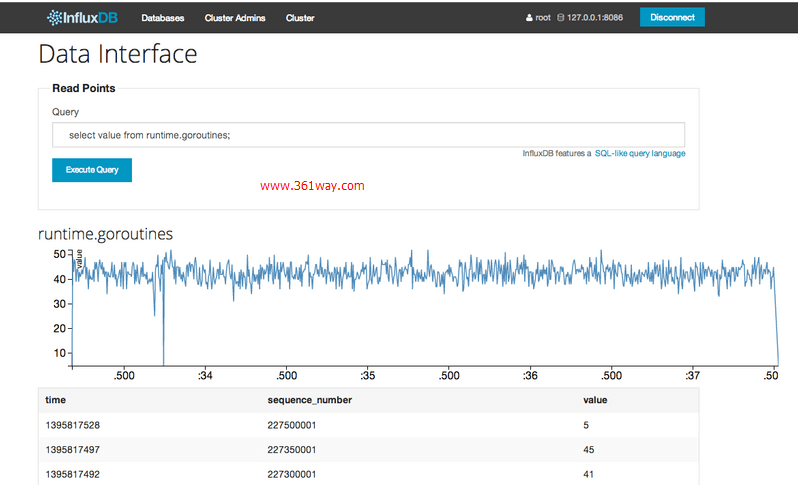
- Built-in Explorer 自带管理工具
管理界面:
API
InfluxDB 支持两种api方式
- HTTP API
- Protobuf API
Protobuf 还未开发完成, 官网文档都没有。如何使用 http api 进行操作?
比如对于foo_production这个数据库,插入一系列数据,可以发现POST请求到/db/foo_production/series?u=some_user&p=some_password, 数据放到body里。
数据看起来是这样的:
下面的"name": “events”, 其中"events"就是一个series,类似关系型数据库的表table
 1[
 2  {
 3    "name": "events",
 4    "columns": ["state", "email", "type"],
 5    "points": [
 6      ["ny", "[email protected]", "follow"],
 7      ["ny", "[email protected]", "open"]
 8    ] },
 9  {
10    "name": "errors",
11    "columns": ["class", "file", "user", "severity"],
12    "points": [
13      ["DivideByZero", "example.py", "[email protected]", "fatal"]
14    ] }
15]
格式是json,可以在一个POST请求发送多个series, 每个series里的points可以是多个,但索引要和columns对应。上面的数据里没有包含time列,InfluxDB会自己加上,不过也可以指定time,比如:
 1[
 2  {
 3    "name": "response_times",
 4    "columns": ["time", "value"],
 5    "points": [
 6      [1382819388, 234.3],
 7      [1382819389, 120.1],
 8      [1382819380, 340.9]
 9    ] }
10]
time 在InfluxDB里是很重要的,毕竟InfluxDB是time series database 在InfluxDB里还有个sequence_number字段是数据库维护的,类似于mysql的 主键概念,InfluxDB 增删更查都是用http api来完成,甚至支持使用正则表达式删除数据,还有计划任务。
比如:发送POST请求到/db/:name/scheduled_deletes, body如下,
1{
2  "regex": "stats\..*",
3  "olderThan": "14d",
4  "runAt": 3 }
这个查询会删除大于14天的数据,并且任何以stats开头的数据,并且每天3:00 AM运行。
更加详细查看官方文档: http://influxdb.org/docs/api/http.html
查询语言
InfluxDB 提供了类似sql的查询语言,看起来是这样的:
1select * from events where state == 'NY';
2select * from log_lines where line =~ /error/i;
3select * from events where customer_id == 23 and type == 'click'; select * from response_times where value > 500;
4select * from events where email !~ /.*gmail.*/;
5select * from nagios_checks where status != 0;
6select * from events where (email =~ /.*gmail.* or email =~ /.*yahoo.*/) and state == 'ny';
7delete from response_times where time > now() - 1h
非常容易上手, 还支持Group By,Merging Series,Joining Series, 并内置常用统计函数,比如max, min, mean 等
文档: http://influxdb.org/docs/query_language/
库
常用语言的库都有,因为api简单,也很容易自己封装。
InfluxdDB作为很多监控软件的后端,这样监控数据就可以直接存储在InfluxDB StatsD,CollectD,FluentD
还有其它的可视化工具支持InfluxDB, 这样就可以基于InfluxDB很方便的搭建监控平台
InfluxDB 数据可视化工具
InfluxDB 用于存储基于时间的数据,比如监控数据,因为InfluxDB本身提供了Http API,所以可以使用InfluxDB很方便的搭建了个监控数据存储中心。
对于InfluxDB中的数据展示,官方admin有非常简单的图表, 看起来是这样的
除了自己写程序展示数据还可以选择:
tasseo
tasseo,为Graphite写的Live dashboard,现在也支持InfluxDB,tasseo 比较简单, 可以配置的选项很少。
Grafana
Grafana是一个纯粹的html/js应用,访问InfluxDB时不会有跨域访问的限制。只要配置好数据源为InfluxDB之后就可以,剩 下的工作就是配置图表。Grafana 功能非常强大。使用ElasticsSearch保存DashBoard的定义文件,也可以Export出JSON文件(Save ->Advanced->Export Schema),然后上传回它的/app/dashboards目录。
配置数据源:
1datasources: { influx: {
2        default: true,
3        type: 'influxdb',
4        url: 'http://<your_influx_db_server>:8086/db/<db_name>',
5        username: 'test',
6        password: 'test', }
7    },
捐赠本站(Donate)
 如您感觉文章有用,可扫码捐赠本站!(If the article useful, you can scan the QR code to donate))
- Author: shisekong
- Link: https://blog.361way.com/influxdb/4908.html
- License: This work is under a 知识共享署名-非商业性使用-禁止演绎 4.0 国际许可协议. Kindly fulfill the requirements of the aforementioned License when adapting or creating a derivative of this work.


