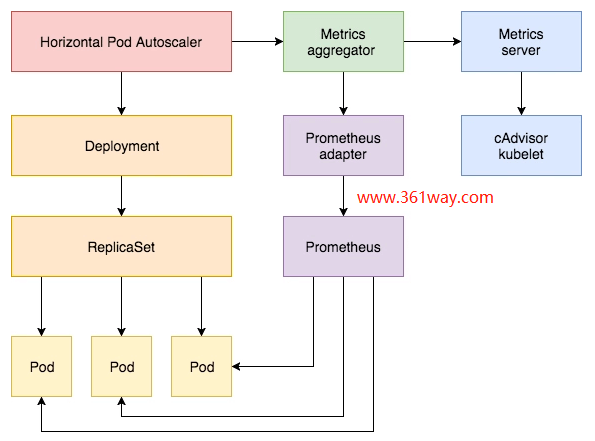
K8S中使用自定义指标进行HPA扩缩容
k8s的默认扩缩容使用的是metrics-server来实现的,一般自指义指标(custom HPA)通过prometheus和prometheus-adapter来实现的。Prometheus 用于监控应用的负载和集群本身的各种指标,Prometheus Adapter 可以帮我们使用 Prometheus 收集的指标并使用它们来制定扩展策略,这些指标都是通过 APIServer 暴露的。
一、环境准备
这里还是选用的华为CCE,免去安装k8s、Prometheus、prometheus-adapter的过程中(虽然并不复杂,但是和点击几下更省事),装完勾选上Prometheus插件,两者就都装好了。
这里选用的测试镜像使用的是nginx和nginx-exporter,这个可以参看之前的《K8S中使用Prometheus监控nginx指标》。
通过以下指令确认相关信息:
 1# 确认nginx应用已经运行
 2[root@testcce-68506-l3jp4 nginx]# kubectl get pods -o wide
 3NAME                             READY   STATUS    RESTARTS   AGE    IP             NODE            NOMINATED NODE   READINESS GATES
 4nginx-exporter-5dc4dcd94-6tdp7   2/2     Running   0          37m    172.16.0.135   192.168.0.211   <none>           <none>
 5
 6# 确认可以通过链接可以正常获取metrics数据
 7[root@testcce-68506-l3jp4 nginx]# curl 172.16.0.135:9113/metrics
 8# TYPE nginx_http_requests_total counter
 9nginx_http_requests_total 198  //可以看到该项配置
10</none></none>
上面nginx_http_requests_total这项就是后面我们HPA要用的指标。
确认k8s支持自定义指标:
1# kubectl get apiservices
2# kubectl get apiservices v1beta1.custom.metrics.k8s.io
3# kubectl api-resources
4# kubectl api-resources|grep metrics.k8s.io
二、自定义策略、配置HPA
配置自定义prometheus-adapter-config配置
获取当前adapter-config的策略配置
1kubectl -n monitoring get configmaps adapter-config -o yaml > rule.yaml
编辑该配置,增加自定义的参数配置,在rules下面增加自定义的配置部分:
 1apiVersion: v1
 2data:
 3  config.yaml: |-
 4    rules:
 5    - seriesQuery: '{__name__=~"^http_requests_.*",kubernetes_pod_name!="",kubernetes_namespace!=""}'  //这里也可以精确使用nginx_http_requests_total
 6      resources:
 7        overrides:
 8          kubernetes_namespace:
 9            resource: namespace
10          kubernetes_pod_name:
11            resource: pod
12      name:
13        matches: ^(.*)_total$
14        as: "${1}_per_second"
15      metricsQuery: (sum(rate(>{>}[1m])) by (>))
使用的时候需要删除以下四行内容,不然会报错Operation cannot be fulfilled on configmaps "ads-central-configuration": the object has been modified; please apply your changes to the latest version and try again**:
1creationTimestamp:
2resourceVersion:
3selfLink:
4uid:
获取所有的自定义指标,理论应该能看到nginx_http_requests_per_second(因为matches as进行了替换,不过在CCE上比较奇怪的是后面一部分没替换上,显示的名字是nginx_http_requests,只正则了前面一部分:broken_heart:):
1kubectl get --raw="/apis/custom.metrics.k8s.io/v1beta1"
上面指令输出比较多,使用这个命令可以格式化输出(后面也可以加管道jq. 或 python -m json.tool格式化查看)。
1kubectl get --raw "/apis/custom.metrics.k8s.io/v1beta1/namespaces/default/pods/*/nginx_http_requests" | python -m json.tool
配置HPA
 1[root@testcce-68506-l3jp4 nginx]# more hpa.yaml
 2apiVersion: autoscaling/v2beta1
 3kind: HorizontalPodAutoscaler
 4metadata:
 5  name: nginx-custom-hpa
 6spec:
 7  scaleTargetRef:
 8    apiVersion: apps/v1
 9    kind: Deployment
10    name: nginx-exporter
11  minReplicas: 2
12  maxReplicas: 5
13  metrics:
14  - type: Pods
15    pods:
16      metricName: nginx_http_requests
17      targetAverageValue: 10
配置HPA策略,应用后可以通过watch 'kubectl get hpa' 和 kubectl describe hpa nginx-custom-hpa 查看详细信息。
1[root@testcce-68506-l3jp4 nginx]# kubectl get hpa
2NAME               REFERENCE                   TARGETS   MINPODS   MAXPODS   REPLICAS   AGE
3nginx-custom-hpa   Deployment/nginx-exporter   88m/10    2         5         2          3h39m
注意上面targets里的88m部分,1000m代表1,这个是和平时配置CPU使用配额部分是一样的,这个代码每秒一次请求。
验证测试
可以通过kubectl expose deployment nginx-exporter --type=NodePort --name=nginx-nodeport --port=80进行服务暴漏,通过以下方式进行访问:
 1[root@testcce-68506-l3jp4 nginx]# kubectl describe svc nginx-nodeport
 2Name:                     nginx-nodeport
 3Namespace:                default
 4Labels:                   <none>
 5Annotations:              <none>
 6Selector:                 app=nginx-exporter
 7Type:                     NodePort
 8IP:                       10.247.52.252
 9Port:                     <unset>  80/TCP
10TargetPort:               80/TCP
11NodePort:                 <unset>  31029/TCP
12Endpoints:                172.16.0.130:80,172.16.0.131:80
13Session Affinity:         None
14External Traffic Policy:  Cluster
15Events:                   <none>
16[root@testcce-68506-l3jp4 nginx]# kubectl get nodes
17NAME            STATUS   ROLES    AGE     VERSION
18192.168.0.211   Ready    <none>   5h11m   v1.19.10-r0-CCE21.11.1.B005-21.11.1.B005
19192.168.0.241   Ready    <none>   5h10m   v1.19.10-r0-CCE21.11.1.B005-21.11.1.B005
20[root@testcce-68506-l3jp4 nginx]# curl 192.168.0.211:31029
21
22
23
24<title>Welcome to nginx!</title>
25<style>
26html { color-scheme: light dark; }
27body { width: 35em; margin: 0 auto;
28font-family: Tahoma, Verdana, Arial, sans-serif; }
29</style>
30
31
32<h1>Welcome to nginx!</h1>
33If you see this page, the nginx web server is successfully installed and
34working. Further configuration is required.
35
36For online documentation and support please refer to
37<a href="http://nginx.org/">nginx.org</a>.<br></br>
38Commercial support is available at
39<a href="http://nginx.com/">nginx.com</a>.
40
41<em>Thank you for using nginx.</em>
42
43
44</none></none></none></unset></unset></none></none>
接下来写一个简单的while循环进行压测:
 1[root@testcce-68506-l3jp4 nginx]# while true;do curl 192.168.0.211:31029;done
 2# 另开一个终端,可以通过watch 'kubectl get hpa'查看变化过程
 3[root@testcce-68506-l3jp4 ~]# kubectl get hpa
 4NAME               REFERENCE                   TARGETS     MINPODS   MAXPODS   REPLICAS   AGE
 5nginx-custom-hpa   Deployment/nginx-exporter   25757m/10   2         5         2          3h49m
 6[root@testcce-68506-l3jp4 ~]# kubectl get hpa
 7NAME               REFERENCE                   TARGETS     MINPODS   MAXPODS   REPLICAS   AGE
 8nginx-custom-hpa   Deployment/nginx-exporter   55741m/10   2         5         4          3h49m
 9[root@testcce-68506-l3jp4 ~]# kubectl get hpa
10NAME               REFERENCE                   TARGETS     MINPODS   MAXPODS   REPLICAS   AGE
11nginx-custom-hpa   Deployment/nginx-exporter   55741m/10   2         5         4          3h49m
12[root@testcce-68506-l3jp4 ~]# kubectl get pods
13NAME                             READY   STATUS    RESTARTS   AGE
14nginx-exporter-5dc4dcd94-6tdp7   2/2     Running   2          3h49m
15nginx-exporter-5dc4dcd94-99vq5   2/2     Running   2          3h47m
16nginx-exporter-5dc4dcd94-kzcnx   2/2     Running   0          35s
17nginx-exporter-5dc4dcd94-lfwvp   2/2     Running   0          35s
18nginx-exporter-5dc4dcd94-mmmsv   2/2     Running   0          20s
19web-terminal-6f975b97d7-6qrrf    1/1     Running   1          5h9m
最后可以看到nginx-exporter变成了5个pod后就不再增加了。
不过需要注意的是,缩容没那么快,需要等5分钟后(300秒),这个是由behavior字段控制的:
 1behavior:
 2  scaleDown:
 3    stabilizationWindowSeconds: 300
 4    policies:
 5    - type: Percent
 6      value: 100
 7      periodSeconds: 15
 8  scaleUp:
 9    stabilizationWindowSeconds: 0
10    policies:
11    - type: Percent
12      value: 100
13      periodSeconds: 15
14    - type: Pods
15      value: 4
16      periodSeconds: 15
17    selectPolicy: Max
想要调整快速回收,也可以通过配置该项内容进行控制。具体也可以参看官方文档和知乎上的说明。
后记:
解决配置自定义prometheus-adapter-config配置 部分中正则不生效的问题。
通过查询了比较多的资料并频繁测试,总终发现每次更新完rule文件后,需要重启custom-metrics-apiserver服务才可以生效。
1、我们可以在这里配置rule

更新rule配置:
重启apiserver并生效,由于是容器化部署,可以通过删除容器,由k8s自行重建完成重启操作:
执行查看,结果如下:
1➜  ~ kubectl get --raw="/apis/custom.metrics.k8s.io/v1beta1" | jq |grep nginx|grep per
2      "name": "pods/nginx_http_requests_per_second",
3      "name": "namespaces/nginx_http_requests_per_second",
捐赠本站(Donate)
 如您感觉文章有用,可扫码捐赠本站!(If the article useful, you can scan the QR code to donate))
- Author: shisekong
- Link: https://blog.361way.com/k8s-custom-hpa/6698.html
- License: This work is under a 知识共享署名-非商业性使用-禁止演绎 4.0 国际许可协议. Kindly fulfill the requirements of the aforementioned License when adapting or creating a derivative of this work.