Linux cache命中率查看
一、需求与背景
LINUX主机上的内存很为user、buffer、cache这个大的块。经常在使用free -m查看时,会发现cache占去了大头,从理论上我们也一直都知道cache里存放的是系统上访问的热数据(不经常访问的数据会被标记后,更换为新的数据),这样会加快主机的访问速度。而cache内部这些数据的命中率如何查看呢?今天在跟相关人员分析现网一个问题时,有同事提到的一个问题。
二、cache命中率计算方法
网上找了下Brendan Gregg 在 perf-tools 里集成了一个工具cachestat,可以查看cache命中率,该工具是用shell 写的,读了下源码,发现其是通过读取/sys/kernel/debug/tracing/trace_stat/ 目录下的所有function调用,查看其中的四项内容:
1mark_page_accessed() for measuring cache accesses
2mark_buffer_dirty() for measuring cache writes
3add_to_page_cache_lru() for measuring page additions
4account_page_dirtied() for measuring page dirties
而四者之间的值是按如下公式计算的:
1总cache page数(total) = mark_page_accessed(标记为访问的) - mark_buffer_dirty(标记为脏的)
2misses = add_to_page_cache_lru(新增的) - account_page_dirtied (统计为脏状态的)
3total - misses = hit
4hit/total =  ratio (命中率)
这里给一个读取人trace_stat下的文件的内容,如下:

在该工具同时还读取了/proc/meminfo,不过读取该文件并不参与命中率计算,读取这个文件的内容只是用于算出目前使用的cache大小,并在界面输出。
三、cachestat代码及执行
cachestat代码如下:
 1#!/bin/bash
 2# 28-Dec-2014   Brendan Gregg   Created this.
 3### default variables
 4tracing=/sys/kernel/debug/tracing
 5interval=1; opt_timestamp=0; opt_debug=0
 6trap 'quit=1' INT QUIT TERM PIPE HUP    # sends execution to end tracing section
 7function usage {
 8    cat &2
 9    USAGE: cachestat [-Dht] [interval]
10                     -D              # print debug counters
11                     -h              # this usage message
12                     -t              # include timestamp
13                     interval        # output interval in secs (default 1)
14      eg,
15           cachestat                 # show stats every second
16           cachestat 5               # show stats every 5 seconds
17    See the man page and example file for more info.
18END
19    exit
20}
21function warn {
22    if ! eval "$@"; then
23        echo >&2 "WARNING: command failed \"$@\""
24    fi
25}
26function die {
27    echo >&2 "$@"
28    exit 1
29}
30### process options
31while getopts Dht opt
32do
33    case $opt in
34    D)  opt_debug=1 ;;
35    t)  opt_timestamp=1 ;;
36    h|?)    usage ;;
37    esac
38done
39shift $(( $OPTIND - 1 ))
40### option logic
41if (( $# )); then
42    interval=$1
43fi
44echo "Counting cache functions... Output every $interval seconds."
45### check permissions
46cd $tracing || die "ERROR: accessing tracing. Root user? Kernel has FTRACE?
47    debugfs mounted? (mount -t debugfs debugfs /sys/kernel/debug)"
48### enable tracing
49sysctl -q kernel.ftrace_enabled=1   # doesn't set exit status
50printf "mark_page_accessed\nmark_buffer_dirty\nadd_to_page_cache_lru\naccount_page_dirtied\n" > set_ftrace_filter || \
51    die "ERROR: tracing these four kernel functions: mark_page_accessed,"\
52    "mark_buffer_dirty, add_to_page_cache_lru and account_page_dirtied (unknown kernel version?). Exiting."
53warn "echo nop > current_tracer"
54if ! echo 1 > function_profile_enabled; then
55    echo > set_ftrace_filter
56    die "ERROR: enabling function profiling. Have CONFIG_FUNCTION_PROFILER? Exiting."
57fi
58(( opt_timestamp )) && printf "%-8s " TIME
59printf "%8s %8s %8s %8s %12s %10s" HITS MISSES DIRTIES RATIO "BUFFERS_MB" "CACHE_MB"
60(( opt_debug )) && printf "  DEBUG"
61echo
62### summarize
63quit=0; secs=0
64while (( !quit && (!opt_duration || secs  function_profile_enabled
65    echo 1 > function_profile_enabled
66    sleep $interval
67    (( opt_timestamp )) && printf "%(%H:%M:%S)T " -1
68    # cat both meminfo and trace stats, and let awk pick them apart
69    cat /proc/meminfo trace_stat/function* | awk -v debug=$opt_debug '
70    # match meminfo stats:
71    $1 == "Buffers:" && $3 == "kB" { buffers_mb = $2 / 1024 }
72    $1 == "Cached:" && $3 == "kB" { cached_mb = $2 / 1024 }
73    # identify and save trace counts:
74    $2 ~ /[0-9]/ && $3 != "kB" { a[$1] += $2 }
75    END {
76        mpa = a["mark_page_accessed"]
77        mbd = a["mark_buffer_dirty"]
78        apcl = a["add_to_page_cache_lru"]
79        apd = a["account_page_dirtied"]
80        total = mpa - mbd
81        misses = apcl - apd
82        if (misses /dev/null
83echo "Ending tracing..." 2>/dev/null
84warn "echo 0 > function_profile_enabled"
85warn "echo > set_ftrace_filter"
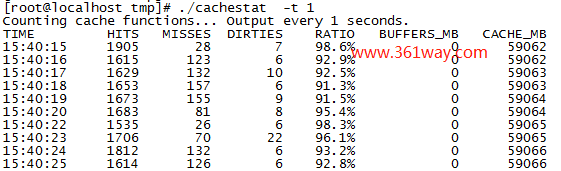
脚本执行后,结果如下:
参考页面:
捐赠本站(Donate)
 如您感觉文章有用,可扫码捐赠本站!(If the article useful, you can scan the QR code to donate))
- Author: shisekong
- Link: https://blog.361way.com/linux-cachestat/5894.html
- License: This work is under a 知识共享署名-非商业性使用-禁止演绎 4.0 国际许可协议. Kindly fulfill the requirements of the aforementioned License when adapting or creating a derivative of this work.