也看monit监控
现在国内的主流开源监控以nagios为首,nagios确实功能足够的强,已经成了监控行业的工业标准。而且能和其他一些出色的监控工具(如:cacti 、Ganglia)进行整合。对于一般的公司使用来说,已经足够了。不过了解一下其他监控软件也未尝不可,可以在一些方面对nagios做个补充和对比。
无意间在网上看到了开源监控工具monit,网上对其的评价颇高。很多人称其为神器。所以我也试了下其具体效果。使用心得也记录下。
一、monit的安装
其下载页面为http://mmonit.com/monit/download/ ,根据自己的系统版本不同,可以选择相应的发行版(目前最近版为5.5版)。此处我选择的是linux-x86版 。
1wget http://mmonit.com/monit/dist/binary/5.5/monit-5.5-linux-x64.tar.gz
2tar zxvf monit-5.5-linux-x64.tar.gz
3cp monit-5.5/bin/monit /usr/local/bin/monit
4cp monit-5.5/conf/monitrc /etc/
因为该软件是直接编绎好的,直接拿来就可以使用。我方面我倒是很喜欢。其配置起来倒是比nagios简单。只有一个配置文件monitrc 。
二、配置
 1set daemon  60              # check services at 1-minute intervals
 2set logfile syslog facility log_daemon
 3set idfile /var/.monit.id
 4set statefile /var/.monit.state
 5set mailserver localhost
 6 set eventqueue
 7     basedir /var/monit  # set the base directory where events will be stored
 8     slots 1000           # optionally limit the queue size
 9 set mmonit http://monit:[email protected]:8080/collector
10     # 配置mmonit的连接信息上面的monit:monit是mmonit上面的用户名和密码
11 set mail-format {
12     from: monit@$HOST
13     subject: monit alert --  $EVENT $SERVICE
14     message: $EVENT Service $SERVICE
15                 Date:        $DATE
16                 Action:      $ACTION
17                 Host:        $HOST
18                 Description: $DESCRIPTION
19                 Your faithful employee,
20            Monit
21 }
22set alert [email protected] reminder only on 3 cycles #设置超出伐值几次收到邮件告警
23set httpd port 2812 and
24    use address 192.168.10.24  #此处地址要改成自己的IP,用默认localhost时,其他主机通过http无法访问
25    allow localhost        # allow localhost to connect to the server and
26    allow 192.168.10.24        # allow localhost to connect to the server and
27    allow 192.168.20.168        # allow localhost to connect to the server and
28    allow admin:monit      # require user 'admin' with password 'monit'
29    allow @monit           # allow users of group 'monit' to connect (rw)
30    allow @users readonly  # allow users of group 'users' to connect readonly
31  check system host24
32    if loadavg (1min) > 4 then alert
33    if loadavg (5min) > 2 then alert
34    if memory usage > 75% then alert
35    if swap usage > 25% then alert
36    if cpu usage (user) > 70% then alert
37    if cpu usage (system) > 30% then alert
38    if cpu usage (wait) > 20% then alert
39check filesystem  gen with path /
40   if space usage > 70% then alert
41   if inode usage > 85% then alert
42check filesystem  boot with path /boot
43   if space usage > 70% then alert
44   if inode usage > 85% then alert
45check process nginx with pidfile /usr/local/nginx/logs/nginx.pid
46   start program = "/usr/local/nginx/sbin/nginx"
47   stop program = "/usr/local/nginx/sbin/nginx -s stop"
48   if failed host 192.168.10.24 port 80 protocol http then restart
49   if cpu > 60% for 2 cycles then alert
50   if cpu > 80% for 5 cycles then restart
51  include /etc/monit.d/*   #可以将其他配置放到这个目录里
上面是一个简单的配置示例,具体每一项的含义在monitrc文件里都有说明。如果想对其他服务进行监控,可以参看官方上的示例。
三、运行和查看
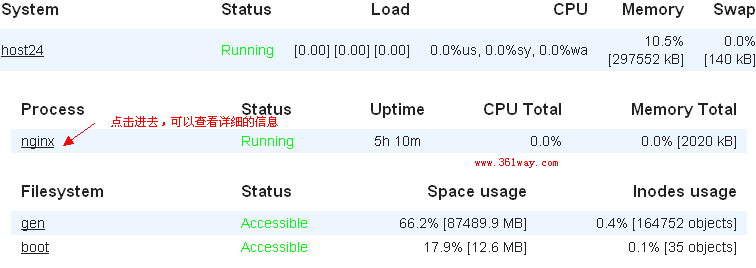
可以通过monit -c /etc/monitrc 进行启动。后面的-c选项也可以不加,不加的话其默认会从~/monitrc 、/etc/monitrc两个位置去找配置文件。其他相关参数可通过monit -h查看。启动完成后,可以通过http://IP:2812(端口可以在配置文件中进行更改) 查看具体监控信息(默认用户名密码是admin monit)。下图为登录后的监控截图
详细帮忙文件可以通过 less monit-5.5/man/man1/monit.1 查看man手册。也可以查看官方wiki页面上的帮助文档。
四、总结
该工具为C语言写成,处理效率上非常高。占用资源非常低(几乎不占用资源),配置参数十分简单——只是几个if 、then语句就可以完成。尤其适用于对某些进程进行守护。如在检测到http服务不正常时,自动重启apache或nginx 。但监控功能,相较nagios略显简单。
捐赠本站(Donate)
 如您感觉文章有用,可扫码捐赠本站!(If the article useful, you can scan the QR code to donate))
- Author: shisekong
- Link: https://blog.361way.com/monit/1776.html
- License: This work is under a 知识共享署名-非商业性使用-禁止演绎 4.0 国际许可协议. Kindly fulfill the requirements of the aforementioned License when adapting or creating a derivative of this work.