nagios snmp流量监控之check_traffic.sh
公司机房新增了一台H3C S5024P交换机做为内网之间机器互通用 。其本身支持通过web查看,不过由于对该机没有配置公网IP ,同时每次都登录查看感觉很不方便。所认就想到利用nagios 和snmp来进行监控。可以进行snmp监控的nagios插件很多,不过也可以自己根据snmp协议来写 。既然有现成的,就懒得写了,直接拿来“ 石头”的shell版的check_traffice.sh来监控交换机流量并配置告警。
一、安装
1、安装snmp包并配置snmpd.conf文件
1yum -y install net-snmp*
直接一条命令就可以完成所需的snmp包的安装。接着修改/etc/snmpd.conf文件为如下内容:
1# sec.name source community
2com2sec notConfigUser 127.0.0.1(localhost也可不改) XXXX(共同体名)
3# group context sec.model sec.level prefix read write notif
4access notConfigGroup "" any noauth exact mib2 none none
5#改system为mib2
6view mib2 included .iso.org.dod.internet.mgmt.mib-2 fc
7#去掉前面的"#"注释符
2、上传插件
上传check_traffic.sh至/App/nagios/libexec目录修改属主并赋予可执行权限。
1chown nagios.nagios check_traffic.sh
2chmod +x check_traffic.sh
3、获取网卡index值
 1[root@web3 ~]# /App/nagios/libexec/check_traffic.sh -V 2c -C public -H 192.168.8.254 -L
 2List Interface for host 192.168.8.254.
 3Interface index 262 orresponding to  InLoopBack0
 4Interface index 390 orresponding to  Aux0/0
 5Interface index 518 orresponding to  GigabitEthernet0/1
 6Interface index 646 orresponding to  GigabitEthernet0/2
 7Interface index 774 orresponding to  GigabitEthernet0/3
 8Interface index 902 orresponding to  GigabitEthernet0/4
 9…………………………………………………………………………
10Interface index 3334 orresponding to  Copper0/23
11Interface index 3462 orresponding to  Copper0/24
12Interface index 3590 orresponding to  Fiber0/23
13Interface index 3718 orresponding to  Fiber0/24
14Interface index 3846 orresponding to  Vlan-interface1
再通过脚本检测下是否可以获取流量数据
1/App/nagios/libexec/check_traffic.sh -V 2c -C public -H 192.168.8.254 -I 646 -w 1200,1500 -c 1700,1800 -K -b
2OK - The Traffic In is 356Kbps, Out is 414Kbps, Total is 770Kbps. The Check Interval is 30s |In=356Kbps;1200;1700;0;0 Out=414Kbps;1500;1800;0;0 Total=770Kbps;2700;3500;0;0 Interval=30s;1200;1800;0;0
注:-I 后面的为index值 ;-w后面的是分别是in和out的告警值 ,-c同样是in和out的严重告警值 ;后面的-k -b可以不加,其默认值是-k -b 。也可以改为 -M -b ,其是流量计数单位;该脚本原理是取两个时间段之间值的差,再和时间间隔相除 。其中会用到临时文件,其临时文件存话/var/tmp/目录,以check_traffic开头 。
二、nagios中定义
在command.cfg中增加如下配置:
1define command{
2        command_name    check_traffic
3        # command_line  $USER1$/check_traffic.sh -V 2c -C nagios -H $HOSTADDRESS$ -I $ARG1$ -w $ARG2$ -c $ARG3$ -K -b
4        command_line    $USER1$/check_traffic.sh -V 2c -C nagios -H $ARG4$ -I $ARG1$ -w $ARG2$ -c $ARG3$ -M -b -$ARG5$
5        }
在switch.cfg文件中增加如下配置:
1define service{
2        use     local-service,srv-pnp
3        host_name       SD-Intranet
4        service_description     host35
5        check_command   check_traffic!646!200,100!300,200!192.168.8.254
6        notifications_enabled   1
7        normal_check_interval   5
8        retry_interval  1
9        }
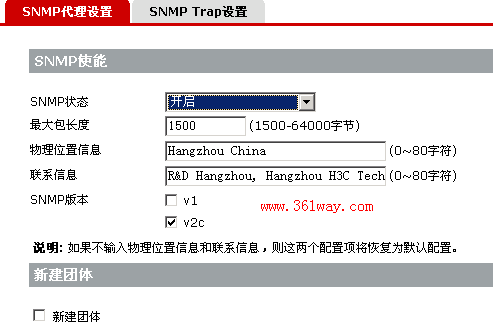
三、交换机配置
默认交换有一个public的共同体,只有读的权限,不过对于我们取SNMP消息完全够用了。如果想要写的权限,也可以新增其他共同体。如果想开启snmp trap,同样也可以在交换机上设置。具体如下图:

四、重载nagios配置文件生效
1、检查文件是否有错
1[root@nagios ~]/App/nagios/bin/nagios -v /App/nagios/etc/nagios.cfg
2、重载生效
1[root@nagios ~]/etc/init.d/nagios reload
五、增加pnp4nagios模板
模板文件内容如下:
 1<?php $opt[1] = "--vertical-label Mbits/s --title "Traffic for $hostname / $servicedesc" ";
 2$colors = array(
 3       'red'=?> '#FF0000',
 4       'green' => '#00FF00',
 5       'blue' => '#0000FF',
 6       'yellow' => '#FFFF00',
 7       'black' => '#000000',
 8       'deepred' => '#330000',
 9        );
10$def[1] =  "DEF:var1=$rrdfile:$DS[1]:AVERAGE " ;
11$def[1] .= "DEF:var2=$rrdfile:$DS[2]:AVERAGE " ;
12$def[1] .= "HRULE:$WARN[1]#FFFF00 ";
13$def[1] .= "HRULE:$CRIT[1]#FF0000 ";
14$def[1] .= "AREA:var1$colors[green]:"In " " ;
15$def[1] .= "GPRINT:var1:LAST:"%6.2lf last" " ;
16$def[1] .= "GPRINT:var1:AVERAGE:"%6.2lf avg" " ;
17$def[1] .= "GPRINT:var1:MAX:"%6.2lf max\n" ";
18$def[1] .= "LINE:var2$colors[blue]:"Out " " ;
19$def[1] .= "GPRINT:var2:LAST:"%6.2lf last" " ;
20$def[1] .= "GPRINT:var2:AVERAGE:"%6.2lf avg" " ;
21$def[1] .= "GPRINT:var2:MAX:"%6.2lf Total\n" " ;
22/*
23$def[1] .= "CDEF:total=var1,var2,+ " ;
24$def[1] .= "LINE1:total$colors[black]:"Total " " ;
25*/
26?>
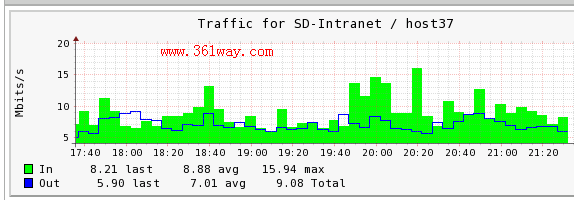
把以上模板命名成和command.cfg里定义的一样的文件,如我的是check_traffic.php放到/App/pnp4nagios/share/templates下 。最张效果图如下:
捐赠本站(Donate)
 如您感觉文章有用,可扫码捐赠本站!(If the article useful, you can scan the QR code to donate))
- Author: shisekong
- Link: https://blog.361way.com/nagios-check_traffic/2579.html
- License: This work is under a 知识共享署名-非商业性使用-禁止演绎 4.0 国际许可协议. Kindly fulfill the requirements of the aforementioned License when adapting or creating a derivative of this work.