python stock数据包tushare
TuShare是一个免费、开源的python财经数据接口包。主要实现对股票等金融数据从数据采集、清洗加工 到 数据存储的过程,能够为金融分析人员提供快速、整洁、和多样的便于分析的数据,为他们在数据来源方面极大地减轻工作量,使他们更加专注于策略和模型的研究与实现上。考虑到Python pandas包在金融量化分析中体现出的优势,TuShare返回的绝大部分的数据格式都是pandas DataFrame类型,非常便于用pandas/NumPy/Matplotlib进行数据分析和可视化。
其支持获取的股市数据有:交易数据、投资参考数据、股票分类数据、基本面数据、龙虎榜数据、宏观经济数据、新闻事件数据、银行间同业拆放利率等大类,每个大类下面又细分一些小类。
一、安装与升级
同其他python模块的安装使用方法一样,即可以通过pip、easy_install 工具包进行安装,也可以通过源码包进行安装。
方式1:pip install tushare
方式2:访问https://pypi.python.org/pypi/tushare/下载安装
从github上的源码包可以看出,作者非常的勤奋,更新的速度非常快,所以也可以通过如下方法进行升级:
1pip install tushare –upgrade
二、数据获取相关
这里以最经常使用的几个交易指标为例,做下汇总。
1、历史数据
 1import tushare as ts
 2ts.get_hist_data('600848') #一次性获取全部日k线数据
 3ts.get_hist_data('600848',start='2015-05-01',end='2015-06-18') #指定时间区间
 4ts.get_hist_data('600848',ktype='W') #获取周k线数据
 5ts.get_hist_data('600848',ktype='M') #获取月k线数据
 6ts.get_hist_data('600848',ktype='5') #获取5分钟k线数据
 7ts.get_hist_data('600848',ktype='15') #获取15分钟k线数据
 8ts.get_hist_data('600848',ktype='30') #获取30分钟k线数据
 9ts.get_hist_data('600848',ktype='60') #获取60分钟k线数据
10ts.get_hist_data('sh')#获取上证指数k线数据,其它参数与个股一致,下同
11ts.get_hist_data('sz')#获取深圳成指k线数据
12ts.get_hist_data('hs300')#获取沪深300指数k线数据
13ts.get_hist_data('sz50')#获取上证50指数k线数据
14ts.get_hist_data('zxb')#获取中小板指数k线数据
15ts.get_hist_data('cyb')#获取创业板指数k线数据
关于复权的概念不了解,这里略过。接下来看实时数据。
2、实时数据
获取当天所有的行情信息,无法指定具体某一支的行情
1import tushare as ts
2ts.get_today_all()
历史分笔与实时分笔(买卖盘统计):
 1import tushare as ts
 2df = ts.get_tick_data('600848',date='2014-01-09')
 3df.head(10)
 4df = ts.get_today_ticks('601333')  #当天历史分笔
 5df.head(10)
 6import tushare as ts
 7df = ts.get_realtime_quotes('000581') #Single stock symbol
 8df[['code','name','price','bid','ask','volume','amount','time']]
 9#symbols from a list
10ts.get_realtime_quotes(['600848','000980','000981'])
11#from a Series
12ts.get_realtime_quotes(df['code'].tail(10))  #一次获取10个股票的实时分笔数据
3、大盘指数
1import tushare as ts
2df = ts.get_index()
4、新股数据
获取打新数据:
1import tushare as ts
2ts.new_stocks()
5、基本面数据
基本面数据里包含选股的很多依据指标,如:市盈率、市净率、每股收益、净利润、季报、应收账款周转率、净利润增长率(%)、流动比率、速动比率、现金流量比率等。
 1import tushare as ts
 2ts.get_stock_basics()
 3#获取2015年第1季度的业绩报表数据
 4ts.get_report_data(2015,1)
 5#获取2015年第1季度的盈利能力数据
 6ts.get_profit_data(2015,1)
 7#获取2015年第1季度的营运能力数据
 8ts.get_operation_data(2015,1)
 9#获取2015年第1季度的成长能力数据
10ts.get_growth_data(2015,1)
11#获取2015年第1季度的偿债能力数据
12ts.get_debtpaying_data(2015,1)
13#获取2015年第1季度的现金流量数据
14ts.get_cashflow_data(2015,1)
三、数据存储
tushare自身提供了常用的数据保存格式:csv格式、excel格式、HDF5文件格式、JSON格式、mysql关系数据库、nosql数据库。
1、to_csv方法
1import tushare as ts
2df = ts.get_hist_data('000875')
3#直接保存
4df.to_csv('c:/day/000875.csv')
5#选择保存
6df.to_csv('c:/day/000875.csv',columns=['open','high','low','close'])
某些时候,可能需要将一些同类数据保存在一个大文件中,这时候就需要将数据追加在同一个文件里,简单举例如下:
1import tushare as ts
2import os
3filename = 'c:/day/bigfile.csv'
4for code in ['000875', '600848', '000981']:
5    df = ts.get_hist_data(code)
6    if os.path.exists(filename):
7        df.to_csv(filename, mode='a', header=None)
8    else:
9        df.to_csv(filename)
2、to_excel方法
1import tushare as ts
2df = ts.get_hist_data('000875')
3#直接保存
4df.to_excel('c:/day/000875.xlsx')
5#设定数据位置(从第3行,第6列开始插入数据)
6df.to_excel('c:/day/000875.xlsx', startrow=2,startcol=5)
3、to_hdf方法
1import tushare as ts
2df = ts.get_hist_data('000875')
3df.to_hdf('c:/day/hdf.h5','000875')
4或
5import tushare as ts
6df = ts.get_hist_data('000875')
7store = HDFStore('c:/day/store.h5')
8store['000875'] = df
9store.close()
4、to_json方法
1import tushare as ts
2df = ts.get_hist_data('000875')
3df.to_json('c:/day/000875.json',orient='records')
4#或者直接使用
5print df.to_json(orient='records')
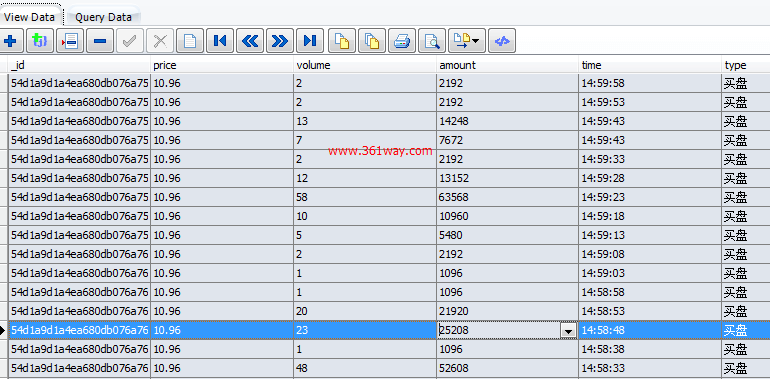
5、to_sql方法
1from sqlalchemy import create_engine
2import tushare as ts
3df = ts.get_tick_data('600848', date='2014-12-22')
4engine = create_engine('mysql://user:[email protected]/db_name?charset=utf8')
5#存入数据库
6df.to_sql('tick_data',engine)
7#追加数据到现有表
8#df.to_sql('tick_data',engine,if_exists='append')
如下图:
5、写入mongodb
通过官方的示例来看,并没有直接提供写入mongodb的方法,不过mongodb支持json格式的输入,这里“曲线救国 ” 下:
1import pymongo
2import json
3conn = pymongo.Connection('127.0.0.1', port=27017)
4df = ts.get_tick_data('600848',date='2014-12-22')
5conn.db.tickdata.insert(json.loads(df.to_json(orient='records')))
四、数据绘图
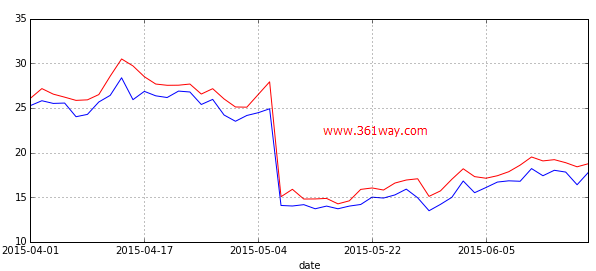
上面都是拾人牙慧的东西,这里来一点点干货。由 tushare 处理输出的格式已经经过整形,所以可以结合pandas模块可以很好的进行汇图,如下:
 1import tushare as ts
 2import pandas as pd
 3df=ts.get_hist_data('600415',start='2015-04-01',end='2015-06-18')
 4# 所有的结果汇图
 5df.plot()
 6# 只将stock最高值进行汇图
 7df.high.plot()
 8# 指定绘图的四个量,并指定线条颜色
 9with pd.plot_params.use('x_compat', True):
10    df.open.plot(color='g')
11    df.close.plot(color='y')
12    df.high.plot(color='r')
13    df.low.plot(color='b')
14# 指定绘图的长宽尺度及背景网格
15with pd.plot_params.use('x_compat', True):
16    df.high.plot(color='r',figsize=(10,4),grid='on')
17    df.low.plot(color='b',figsize=(10,4),grid='on')
上面绘制了四个图,这里只选取第四张图具体可以看下效果:
默认上面的方法,只会输出图片,无法保存图片,所以可以通过matplotlib模块的savefig函数保存图片到指定的位置,代码如下:
1import matplotlib
2import tushare as ts
3import pandas as pd
4fig = matplotlib.pyplot.gcf()
5df=ts.get_hist_data('600415',start='2015-04-01',end='2015-06-18')
6with pd.plot_params.use('x_compat', True):
7    df.high.plot(color='r',figsize=(10,4),grid='on')
8    df.low.plot(color='b',figsize=(10,4),grid='on')
9    fig.savefig('F:/graph.png')
matplotlib模块绘图部分可以参看如下页面:
捐赠本站(Donate)
 如您感觉文章有用,可扫码捐赠本站!(If the article useful, you can scan the QR code to donate))
- Author: shisekong
- Link: https://blog.361way.com/python-stock-tushare/4579.html
- License: This work is under a 知识共享署名-非商业性使用-禁止演绎 4.0 国际许可协议. Kindly fulfill the requirements of the aforementioned License when adapting or creating a derivative of this work.


