Zabbix与RRDtool绘图篇(4)_图形属性归档
每台主机每张图的rrd文件已经创建好了,并且定时每分钟添加从ZabbixAPI取得的监控数据到rrd文件。接下来就得进行图形展示了,在图形 展示前需要将图形归类,不然请求一台主机的图形后还得扒开海量的监控图寻找相关的应用监控图(如nginx、php、redis等)。
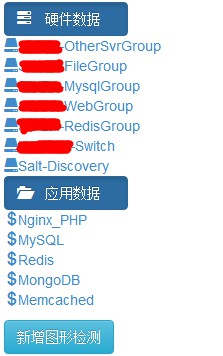
我按要求分了两大类主机硬件类和应用信息类。主机类主要展示主与机器相关的监控图如网络、硬盘、CPU负载、内存等。应用信息大类又细分为Nginx_PHP、MySQL、Redis等。效果如下:
实现这些图形的分类第一步,数据库表的设计models。
 1from django.db import models, connection
 2# Create your models here.
 3#################################################
 4class DrawTreeManager(models.Manager):
 5    def getclass(self, sql):
 6        cursor = connection.cursor()
 7        cursor.execute(sql)
 8        return cursor.fetchall()
 9class DrawTree(models.Model):
10    classname = models.CharField(max_length=64)
11    hostname = models.CharField(max_length=64)
12    hostid = models.CharField(max_length=8)
13    graphid = models.CharField(max_length=8)
14    graphname = models.CharField(max_length=128)
15    draw = models.CharField(max_length=2)
16    type = models.CharField(max_length=2)
17    objects = DrawTreeManager()
18    def __unicode__(self):
19        return self.hostname
20################################################
21class DrawGraphsManager(models.Manager):
22    def getdata(self, sql):
23        cursor = connection.cursor()
24        cursor.execute(sql)
25        return cursor.fetchall()
26class DrawGraphs(models.Model):
27    graphid = models.CharField(max_length=8)
28    itemid = models.CharField(max_length=8)
29    itemname = models.CharField(max_length=128)
30    units = models.CharField(max_length=16, null=True, blank=True)
31    objects = DrawGraphsManager()
32    def __unicode__(self):
33        return self.graphid
34#################################################
35class DrawDefManager(models.Manager):
36    def getdata(self, sql):
37        cursor = connection.cursor()
38        cursor.execute(sql)
39        return cursor.fetchall()
40class DrawDef(models.Model):
41    graphid = models.CharField(max_length=8)
42    cols = models.CharField(max_length=256, null=True, blank=True)
43    types = models.CharField(max_length=256, null=True, blank=True)
44    objects = DrawDefManager()
45    def __unicode__(self):
46        return self.graphid
DrawGraphs表用来存放每张图的所需的信息图形id(graphid)、每张图形包含的item的id和item的名字(itemid、itemname)。根据一个graphid时能够得到这张图形的所有itemid、itemname、unit(item的计数单位),itemid主要是用来冲rrd文件中取对应DS的数据(rrd文件中的DS名我是用的itemid),itemname主要显示图形下面布告牌最大值、最小值神马的,unit就是Y轴显示的单位了。
DrawTree表主要用来存放图形的层叠导航信息的。遍历所有的图形,根据图形名的关键字将每幅图归档。classname字段存放每组的组名,硬件数据的组名取Zabbix的默认分组,应用数据的分组是我自定义的分组如Nginx_PHP、Redis、MySQL等分组。hostname字段对应主机名、hostid对应主机id、graphname对应图形名、graphid对应图形id,draw对应图形是否显示的标志位(1显示、0不显示),type代表图形的分类(0代表硬件信息、1代表Nginx_PHP、2代表MySQL以此类推)。
DrawDef表用来存放自定义图形显示所需的信息。graphid字段为需要自定义显示图形的图形id,cols代表需要自定义图形的颜色代码每种颜色用分号隔开,types对应需要自定义的绘图方法如线性(LINE1、LINE2、LINE3)、区块(AREA)等。
更新DrawTree与跟新DrawGraphs记录是同时进行的(为了精简代码和逻辑),views相关的代码是这样的:
 1def zabbixindex(request):
 2    if request.method == 'GET':
 3        for key in request.GET:
 4            value = request.GET[key]
 5            break
 6        if value == 'check':
 7            zbx = Zabbix()
 8            groupinfo = zbx.group_get()
 9            hostsinfo = zbx.hostsid_get()
10            for host in groupinfo:
11                groupid = host['groupid']
12                groupname = host['groupname']
13                hostid = host['hostid']
14                hostname = ''
15                for i in hostsinfo:
16                    if i.values()[0] == hostid:
17                        hostname = i.keys()[0]
18                        break
19                hostgraphs = zbx.hostgraph_get(hostname)
20                for graph in hostgraphs:
21                    graphid = graph['graphid']
22                    graphname = graph['name']
23                    #不存在的图形才更新
24                    #图形展示分类
25                    flag = DrawTree.objects.filter(graphid=graphid)
26                    if not flag:
27                        #更新zabbixapp_drawtree表
28                        draw = '1'
29                        if 'PHP-FPM' in graphname or 'Nginx' in graphname:
30                            type = '1'
31                            classname = 'Nginx_PHP'
32                        elif 'MySQL' in graphname or 'InnoDB' in graphname:
33                            type = '2'
34                            classname = 'MySQL'
35                        elif 'Redis' in graphname:
36                            type = '3'
37                            classname = 'Redis'
38                        elif 'Memcached' in graphname:
39                            type = '4'
40                            classname = 'Memcached'
41                        elif 'MongoDB' in graphname:
42                            type = '5'
43                            classname = 'MongoDB'
44                        else:
45                            classname = groupname
46                            type = '0'
47                        DrawTree.objects.create(classname=classname, hostname=hostname, hostid=hostid, graphid=graphid, graphname=graphname,
48                                                draw=draw, type=type)
49                        #更新zabbixapp_drawgraphs表
50                        itemsinfo = zbx.graphitems_get(graphid)
51                        units = itemsinfo[0]['units']
52                        for item in itemsinfo:
53                            itemid = item['itemid']
54                            itemname = item['name']
55                            DrawGraphs.objects.create(graphid=graphid, itemid=itemid, itemname=itemname, units=units)
56            return HttpResponseRedirect("/graph/zabbix/")
57        #非get或post请求部分,tree
58        ########################
59        sql_0 = "select distinct classname from zabbixapp_drawtree where type='0'"
60        type_0 = DrawTree.objects.getclass(sql_0)
61        typelist0 = []
62        for i in type_0:
63            sql = "select distinct hostname,hostid from zabbixapp_drawtree where classname="+"'"+i[0]+"'"+" and type='0'"
64            chosts = DrawTree.objects.getclass(sql)
65            tmplist = []
66            for chost in chosts:
67                tmp = {'hostname':chost[0], 'hostid':chost[1]}
68                tmplist.append(tmp)
69            typelist0.append({'type':i[0].replace(" ",'-'), 'host':tmplist})
70        ########################
71        sql_1 = "select distinct classname from zabbixapp_drawtree where type!='0'"
72        type_1 = DrawTree.objects.getclass(sql_1)
73        typelist1 = []
74        for i in type_1:
75            sql = "select distinct hostname,hostid,type from zabbixapp_drawtree where classname="+"'"+i[0]+"'"
76            chosts = DrawTree.objects.getclass(sql)
77            tmplist = []
78            for chost in chosts:
79                tmp = {'hostname':chost[0], 'hostid':chost[1]}
80                tmplist.append(tmp)
81            typelist1.append({'type':i[0], 'host':tmplist, 'tflag': chost[2]})
82    #value = typelist1
83    avg = {'privatetitle': 'Zabbix监控数据展示', 'STATIC_URL': '/static', 'list0':typelist0, 'list1':typelist1}
84    return render_to_response('zabbixapp/zabbixindex.html', avg)
该视图函数渲染的模板zabbixindex.html写的比较简单,代码是这样的:
 1{% extends "base.html" %}
 2{% block title %}{{ privatetitle }}{% endblock %}
 3{% block thercss %}
 4{% endblock %}
 5{% block otherjs %}
 6{% endblock %}
 7{% block content %}
 8<div class="container">
 9    <div class="row">
10    <div class="col-md-3">
11        <button type="button" class="btn btn-primary active">
12            <span class="glyphicon glyphicon-tasks"></span> 硬件数据 </button>
13    {% for i in list0 %}
14    <div>
15    <a href="#{{i.type}}" data-toggle="collapse"><i class="glyphicon glyphicon-hdd"></i>{{i.type}}</a>
16    <ul id="{{i.type}}" class="collapse">
17        {% for tmp in i.host %}
18        <li><a  target="draw" href="/graph/zbdraw/?type=0&hostid={{tmp.hostid}}">{{tmp.hostname}}</a></li>
19        {% endfor %}
20    </ul>
21    </div>
22    {% endfor %}
23        <button type="button" class="btn btn-primary active">
24            <span class="glyphicon glyphicon-folder-open"></span> 应用数据 </button>
25    {% for i in list1 %}
26    <div>
27    <a href="#{{i.type}}" data-toggle="collapse"><i class="glyphicon glyphicon-usd"></i>{{i.type}}</a>
28    <ul id="{{i.type}}" class="collapse">
29        {% for tmp in i.host %}
30        <li><a target="draw" href="/graph/zbdraw/?type={{i.tflag}}&hostid={{tmp.hostid}}">{{tmp.hostname}}</a></li>
31        {% endfor %}
32    </ul>
33    </div>
34    {% endfor %}
35    <p></p>
36    <div align="left">
37        <a href="/graph/zabbix/?action=check" class="btn btn-info" role="button">新增图形检测</a>
38    </div>
39    </div>
40<script type="text/javascript">
41    //iframe高度自适应
42    function autoHeight(){
43        var iframe = document.getElementById("draw");
44        if(iframe.Document){//ie自有属性
45            iframe.style.height = iframe.Document.documentElement.scrollHeight;
46        }else if(iframe.contentDocument){//ie,firefox,chrome,opera,safari
47            iframe.height = iframe.contentDocument.body.offsetHeight ;
48        }
49    }
50</script>
51    <div class="col-md-9">
52                <iframe name="draw" id="draw" frameborder="0" scrolling="no" style="width:99%;border:none" onload="autoHeight();"></iframe>
53    </div>
54    </div>
55</div>
56{% endblock %}
从ZabbixAPI取图形的各种属性值,经过适当的分类操作后将分类数据在本地落地,然后取落地后的分类数据将硬件和业务信息分类展示出来。
捐赠本站(Donate)
 如您感觉文章有用,可扫码捐赠本站!(If the article useful, you can scan the QR code to donate))
- Author: shisekong
- Link: https://blog.361way.com/zabbix-rrdtool-4/4114.html
- License: This work is under a 知识共享署名-非商业性使用-禁止演绎 4.0 国际许可协议. Kindly fulfill the requirements of the aforementioned License when adapting or creating a derivative of this work.