Blackbox Exporter监控HTTP健康度
Blackbox Exporter是Prometheus社区提供的官方黑盒监控解决方案,其允许用户通过:HTTP、HTTPS、DNS、TCP以及ICMP的方式对网络进行探测。刚好因为要从事SRE工作,这里就以站点的可用性为例,来结合Blackbox Exporter设定下SLO值。
一、Blackbox Exporter的安装
先从站点上下载最新的blackbox_exporter
1wget https://github.com/prometheus/blackbox_exporter/releases/download/v0.18.0/blackbox_exporter-0.18.0.linux-amd64.tar.gz
2tar xvf blackbox_exporter-*-amd64.tar.gz -C /usr/local/prometheus/
3mv blackbox_exporter-*-amd64/ blackbox_exporter
4useradd prometheus
5chown -R prometheus:prometheus /usr/local/prometheus/
修改成rhel7/8下的服务:
 1vim /usr/lib/systemd/system/blackbox_exporter.service
 2[Unit]
 3Description=blackbox_exporter
 4After=network.target
 5[Service]
 6Type=simple
 7User=prometheus
 8ExecStart=/usr/local/prometheus/blackbox_exporter/blackbox_exporter --config.file=/usr/local/prometheus/blackbox_exporter/blackbox.yml
 9Restart=on-failure
10[Install]
11WantedBy=multi-user.target
12systemctl enable blackbox_exporter.service
13systemctl start blackbox_exporter.service
二、Blackbox Exporter的配置
运行Blackbox Exporter时,需要用户提供探针的配置信息,这些配置信息可能是一些自定义的HTTP头信息,也可能是探测时需要的一些TSL配置,也可能是探针本身的验证行为。在Blackbox Exporter每一个探针配置称为一个module,并且以YAML配置文件的形式提供给Blackbox Exporter。 每一个module主要包含以下配置内容,包括探针类型(prober)、验证访问超时时间(timeout)、以及当前探针的具体配置项:
1# 探针类型:http、 tcp、 dns、 icmp.
2prober:
3# 超时时间
4[ timeout:  ]
5# 探针的详细配置,最多只能配置其中的一个
6[ http:  ]
7[ tcp:  ]
8[ dns:  ]
9[ icmp:  ]
blockbox.yml的配置一般都保持默认,除非有一些检测不需要,可以考虑注释掉或删除掉。内容如下:
 1modules:
 2  http_2xx:
 3    prober: http
 4  http_post_2xx:
 5    prober: http
 6    http:
 7      method: POST
 8  tcp_connect:
 9    prober: tcp
10  pop3s_banner:
11    prober: tcp
12    tcp:
13      query_response:
14      - expect: "^+OK"
15      tls: true
16      tls_config:
17        insecure_skip_verify: false
18  ssh_banner:
19    prober: tcp
20    tcp:
21      query_response:
22      - expect: "^SSH-2.0-"
23  irc_banner:
24    prober: tcp
25    tcp:
26      query_response:
27      - send: "NICK prober"
28      - send: "USER prober prober prober :prober"
29      - expect: "PING :([^ ]+)"
30        send: "PONG ${1}"
31      - expect: "^:[^ ]+ 001"
32  icmp:
33    prober: icmp
修改完成后,通过以下指令启动服务:
blackbox_exporter --config.file=/etc/prometheus/blackbox.yml
or
systemctl restart blackbox_exporter.service
启动成功后,就可以通过访问 http://IP地址:9115/probe?module=http_2xx&target=www.361way.com 对运维之路进行探测。这里通过在URL中提供module参数指定了当前使用的探针,target参数指定探测目标,探针的探测结果通过Metrics的形式返回:
 1# HELP probe_dns_lookup_time_seconds Returns the time taken for probe dns lookup in seconds
 2# TYPE probe_dns_lookup_time_seconds gauge
 3probe_dns_lookup_time_seconds 0.004359875
 4# HELP probe_duration_seconds Returns how long the probe took to complete in seconds
 5# TYPE probe_duration_seconds gauge
 6probe_duration_seconds 0.046153996
 7# HELP probe_failed_due_to_regex Indicates if probe failed due to regex
 8# TYPE probe_failed_due_to_regex gauge
 9probe_failed_due_to_regex 0
10# HELP probe_http_content_length Length of http content response
11# TYPE probe_http_content_length gauge
12probe_http_content_length 81
13# HELP probe_http_duration_seconds Duration of http request by phase, summed over all redirects
14# TYPE probe_http_duration_seconds gauge
15probe_http_duration_seconds{phase="connect"} 0.00105657
16probe_http_duration_seconds{phase="processing"} 0.039457402
17probe_http_duration_seconds{phase="resolve"} 0.004359875
18probe_http_duration_seconds{phase="tls"} 0
19probe_http_duration_seconds{phase="transfer"} 0.000337184
20# HELP probe_http_last_modified_timestamp_seconds Returns the Last-Modified HTTP \
21response header in unixtime
22# TYPE probe_http_last_modified_timestamp_seconds gauge
23probe_http_last_modified_timestamp_seconds 1.26330408e+09
24# HELP probe_http_redirects The number of redirects
25# TYPE probe_http_redirects gauge
26probe_http_redirects 0
27# HELP probe_http_ssl Indicates if SSL was used for the final redirect
28# TYPE probe_http_ssl gauge
29probe_http_ssl 0
30# HELP probe_http_status_code Response HTTP status code
31# TYPE probe_http_status_code gauge
32probe_http_status_code 200
33# HELP probe_http_uncompressed_body_length Length of uncompressed response body
34# TYPE probe_http_uncompressed_body_length gauge
35probe_http_uncompressed_body_length 81
36# HELP probe_http_version Returns the version of HTTP of the probe response
37# TYPE probe_http_version gauge
38probe_http_version 1.1
39# HELP probe_ip_protocol Specifies whether probe ip protocol is IP4 or IP6
40# TYPE probe_ip_protocol gauge
41probe_ip_protocol 4
42# HELP probe_success Displays whether or not the probe was a success
43# TYPE probe_success gauge
44probe_success 1
从返回的样本中,用户可以获取站点的DNS解析耗时,站点响应时间,HTTP响应状态码等等和站点访问质量相关的监控指标,从而帮助管理员主动的发现故障和问题。同时也可以通过访问 http://IP地址:9115查看历史成功的日志。
三、Prometheus集成
需要在Prometheus下配置对Blockbox Exporter实例的采集任务即可、最直观的配置方式。配置信息类似如下:
 1  - job_name: 'yunwei_http2xx_probe'
 2    params:
 3      module:
 4      - http_2xx
 5      target:
 6      - www.361way.com
 7    metrics_path: /probe
 8    static_configs:
 9    - targets: ['172.19.0.27:9115']
10  - job_name: 'prometheus_http2xx_probe'
11    params:
12      module:
13      - http_2xx
14      target:
15      - prometheus.io
16    metrics_path: /probe
17    static_configs:
18    - targets: ['172.19.0.27:9115']
19systemctl restart prometheus
这里分别配置了名为yunwei_http2x_probe和prometheus_http2xx_probe的采集任务,并且通过params指定使用的探针(module)以及探测目标(target)。在启动prometheus后,这时可以通过http://IP地址:9090/target 打开查看当前的target信息。
在对应有多个站点或页面的探测任务时,也可以使用下面Relabling的方式进行配置,如下:
 1  - job_name: 'blackbox'
 2    metrics_path: /probe
 3    params:
 4      module: [http_2xx]
 5    static_configs:
 6      - targets:
 7        - http://prometheus.io    # Target to probe with http.
 8        - https://prometheus.io   # Target to probe with https.
 9        - http://example.com:8080 # Target to probe with http on port 8080.
10    relabel_configs:
11      - source_labels: [__address__]
12        target_label: __param_target
13      - source_labels: [__param_target]
14        target_label: instance
15      - target_label: __address__
16        replacement: 172.19.0.27:9115
这里针对每一个探针服务(如http_2xx)定义一个采集任务,并且直接将任务的采集目标定义为我们需要探测的站点,在采集样本数据之前通过relabel_configs对采集任务进行动态配置。具体说明如下:
- 第一步, 根据Target实例的地址,写入__param_target标签中,__param_形式的标签来表示,在采集任务时会在请求目标地址中添加参数,等同于params的设置.
- 第二步, 获取__param_target的值,并覆写到instance标签中.
- 第三步, 覆写Target实例的address标签值为BlockBox Exporter实例的访问地址.
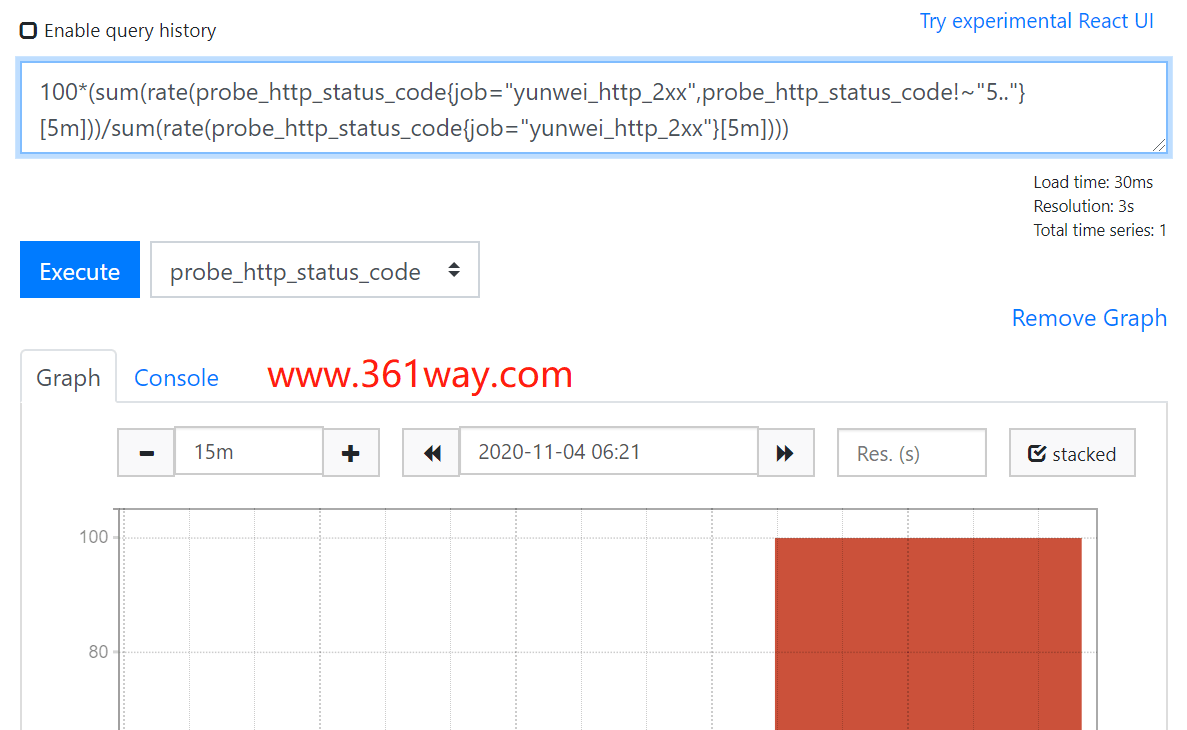
此时通过如下语句执行就可以算出站点的SLO可用性百分比,如下:
1100*(
2sum(rate(probe_http_status_code{job="yunwei_http_2xx",probe_http_status_code!~"5.."}[5m]))
3/sum(rate(probe_http_status_code{job="yunwei_http_2xx"}[5m]))
4)
四、Blackbox Exporter的高阶配置
HTTP服务通常会以不同的形式对外展现,有些可能就是一些简单的网页,而有些则可能是一些基于REST的API服务。 对于不同类型的HTTP的探测需要管理员能够对HTTP探针的行为进行更多的自定义设置,包括:HTTP请求方法、HTTP头信息、请求参数等。对于某些启用了安全认证的服务还需要能够对HTTP探测设置相应的Auth支持。对于HTTPS类型的服务还需要能够对证书进行自定义设置。
如下所示,这里通过method定义了探测时使用的请求方法,对于一些需要请求参数的服务,还可以通过headers定义相关的请求头信息,使用body定义请求内容:
1http_post_2xx:
2    prober: http
3    timeout: 5s
4    http:
5      method: POST
6      headers:
7        Content-Type: application/json
8      body: '{}'
如果HTTP服务启用了安全认证,Blockbox Exporter内置了对basic_auth的支持,可以直接设置相关的认证信息即可:
 1http_basic_auth_example:
 2    prober: http
 3    timeout: 5s
 4    http:
 5      method: POST
 6      headers:
 7        Host: "login.example.com"
 8      basic_auth:
 9        username: "username"
10        password: "mysecret"
对于使用了Bear Token的服务也可以通过bearer_token配置项直接指定令牌字符串,或者通过bearer_token_file指定令牌文件。对于一些启用了HTTPS的服务,但是需要自定义证书的服务,可以通过tls_config指定相关的证书信息:
1 http_custom_ca_example:
2    prober: http
3    http:
4      method: GET
5      tls_config:
6        ca_file: "/certs/my_cert.crt"
在默认情况下HTTP探针只会对HTTP返回状态码进行校验,如果状态码为2XX(200
1http_2xx_example:
2    prober: http
3    timeout: 5s
4    http:
5      valid_http_versions: ["HTTP/1.1", "HTTP/2"]
6      valid_status_codes: []
默认情况下,Blockbox返回的样本数据中也会包含指标probe_http_ssl,用于表明当前探针是否使用了SSL。而如果用户对于HTTP服务是否启用SSL有强制的标准。则可以使用fail_if_ssl和fail_if_not_ssl进行配置。fail_if_ssl为true时,表示如果站点启用了SSL则探针失败,反之成功。fail_if_not_ssl刚好相反。
1http_2xx_example:
2    prober: http
3    timeout: 5s
4    http:
5      valid_status_codes: []
6      method: GET
7      no_follow_redirects: false
8      fail_if_ssl: false
9      fail_if_not_ssl: false
除了基于HTTP状态码,HTTP协议版本以及是否启用SSL作为控制探针探测行为成功与否的标准以外,还可以匹配HTTP服务的响应内容。使用fail_if_matches_regexp和fail_if_not_matches_regexp用户可以定义一组正则表达式,用于验证HTTP返回内容是否符合或者不符合正则表达式的内容。
1http_2xx_example:
2    prober: http
3    timeout: 5s
4    http:
5      method: GET
6      fail_if_matches_regexp:
7        - "Could not connect to database"
8      fail_if_not_matches_regexp:
9        - "Download the latest version here"
最后需要提醒的时,默认情况下HTTP探针会走IPV6的协议。 在大多数情况下,可以使用preferred_ip_protocol=ip4强制通过IPV4的方式进行探测。在Bloackbox响应的监控样本中,也会通过指标probe_ip_protocol,表明当前的协议使用情况:
1# HELP probe_ip_protocol Specifies whether probe ip protocol is IP4 or IP6
2# TYPE probe_ip_protocol gauge
3probe_ip_protocol 6
五、总结
Prometheus监控主机的资源用量、容器的运行状态、数据库中间件的运行数据。 这些都是支持业务和服务的基础设施,通过白盒能够了解其内部的实际运行状态,通过对监控指标的观察能够预判可能出现的问题,从而对潜在的不确定因素进行优化。而从完整的监控逻辑的角度,除了大量的应用白盒监控以外,还应该添加适当的黑盒监控。
黑盒监控即以用户的身份测试服务的外部可见性,常见的黑盒监控包括HTTP探针、TCP探针等用于检测站点或者服务的可访问性,以及访问效率等。黑盒监控相较于白盒监控最大的不同在于黑盒监控是以故障为导向当故障发生时,黑盒监控能快速发现故障,而白盒监控则侧重于主动发现或者预测潜在的问题。一个完善的监控目标是要能够从白盒的角度发现潜在问题,能够在黑盒的角度快速发现已经发生的问题。
Blackbox Exporter + Prometheus就很好的实现了HTTP服务的黑盒监控。当然还其他一些选项,比如:https://gitee.com/kevinliu_CQ/api-monitoring.git 也可以结合Prometheus实现http API的监控。这里就不再介绍,有兴趣的可以参看下 使用Prometheus监控API 。
捐赠本站(Donate)
 如您感觉文章有用,可扫码捐赠本站!(If the article useful, you can scan the QR code to donate))
- Author: shisekong
- Link: https://blog.361way.com/blackbox-exporter/6474.html
- License: This work is under a 知识共享署名-非商业性使用-禁止演绎 4.0 国际许可协议. Kindly fulfill the requirements of the aforementioned License when adapting or creating a derivative of this work.