Distributed Monitoring与MK Livestatus
check_mk的wato配置界面有一个Distributed Monitoring功能,该功能的使用需要依赖mk livestatus插件,livestatus是check_mk中的一部分,也可以独立列开来用。由于livestatus还是一个年轻的项目,不过已经有很多项目对其支持。如:nagvis、nagiosBP、Thruk、CoffeeSaint等(说这项目年轻不是我的有的原话,官网在介绍的时候就是这样说的)。
一、livestatus的安装与配置
默认在完整的check_mk中可以选择是否要安装mk livestatus,不过也可以单独安装livestatus,单独安装的步骤如下:
1http://mathias-kettner.de/download/mk-livestatus-1.2.2p3.tar.gz
2tar zxvf mk-livestatus-1.2.2p3.tar.gz
3cd mk-livestatus-1.2.2p3
4./configure
5make && make install
livestsatus和check_mk_agent一样依赖于xinetd 。其需要在xinetd下新建livestatus文件,具体内容如下:
 1root@s:[/root]cat /etc/xinetd.d/livestatus
 2service livestatus
 3{
 4        type            = UNLISTED
 5        port            = 6557
 6        socket_type     = stream
 7        protocol        = tcp
 8        wait            = no
 9# limit to 100 connections per second. Disable 3 secs if above.
10        cps             = 100 3
11# set the number of maximum allowed parallel instances of unixcat.
12# Please make sure that this values is at least as high as
13# the number of threads defined with num_client_threads in
14# etc/mk-livestatus/nagios.cfg
15        instances       = 500
16# limit the maximum number of simultaneous connections from
17# one source IP address
18        per_source      = 250
19# Disable TCP delay, makes connection more responsive
20        flags           = NODELAY
21        user            = nagios
22        server          = /usr/bin/unixcat
23        server_args     = /var/spool/nagios/cmd/live
24# configure the IP address(es) of your Nagios server here:
25#       only_from       = 127.0.0.1 10.0.20.1 10.0.20.2
26        disable         = no
27}
nagios.cfg中需要增加如下两行:
1vim nagios.cfg
2broker_module=/usr/local/lib/mk-livestatus/livestatus.o /var/lib/nagios/rw/live
3event_broker_options=-1
配置完成后,重启xinetd和nagios使配置生效。
以上配置参考如下页面:
二、livestatus的有效测试
官方主页上提供了N种用于取到livestatus数据的方法,这里只列举一种,通过nc提交测试的方法。如下图所示:
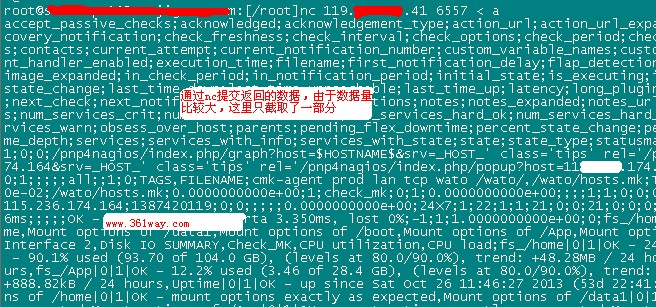
通过上图不难看出,通过nc提交请求到livestatus监控的端口时,有数据返回,表示livestatus应用正常。上图中,文件a中的内容是“GET hosts”,也可以提交其他请求给livestatus,具体可以参看官方说明。
1root:[/root]cat a
2GET hosts
3root:[/root]cat b
4GET services
三、Distributed Monitoring分布式监控
这里直接称之为Distributed Monitoring ,我个人感觉是不准确的。第一,称之为Multisite更准确,可以通过在check_mk提供的界面上配置过后,使另一个nagios站点的数据在该check_mk的界面上展示(但不会在该nagios的web界面上展示)。第二,分布式的监控也不是说不能实现,通过mk livestatus从另一站点取得数据后,可以再利用nsca传送到监控中心服务器,一样算是实现了分布式监控。这里要讲的属于歧义其一的multisite。
正如官网所说的:“Please note, that the current release of Multisite is still not considered stable.” 确实multisite的功能目前来看可能还是比较鸡肋。不过相信有一天其可以比较好的实现真正的Distributed Monitoring ,并且像wato增加主机和服务一样能在nagios 的web界面上进行展现。
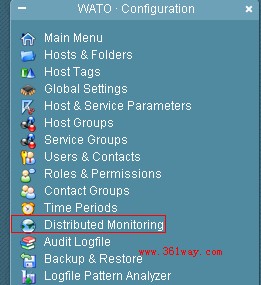
通过wato configuration —- distributed monitoring —– new connection

增加slave主机通过livestatus的tcp连接数据并保存
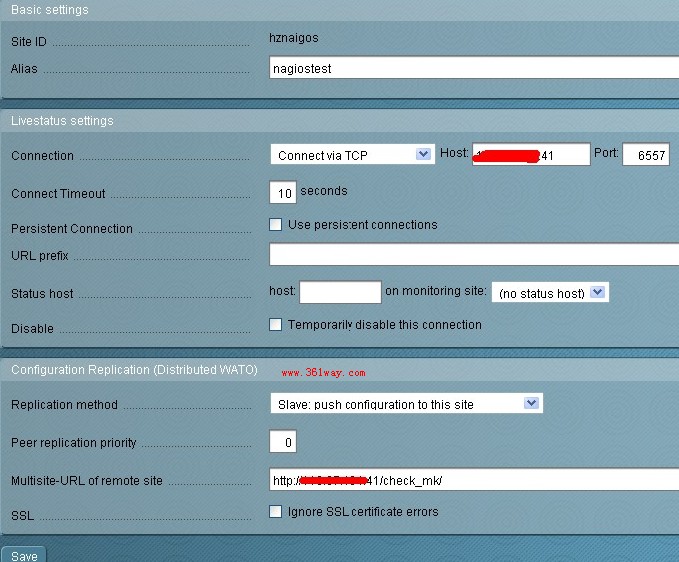
保存后,会让输入远程URL站点的用户名密码并同步数据(默认10秒进行一次数据同步)
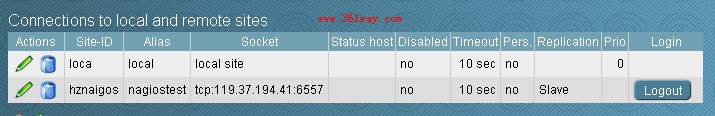
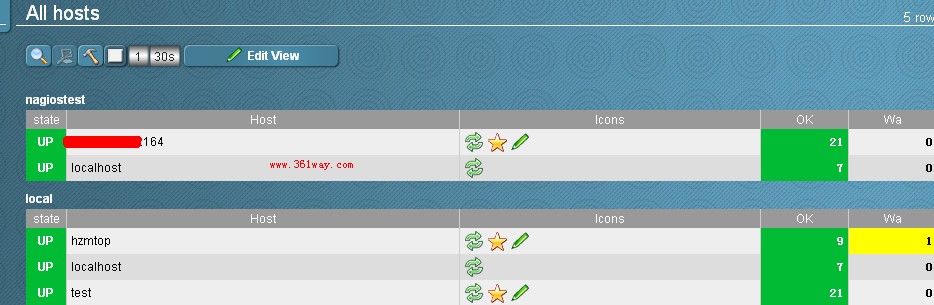
最后在远端的nagios中心新增主机时,在该处的监控中心也可以看到新增的监控主机的情况,如下图,这里显示一个是本地的监控中心的数据,一个是远程监控的数据
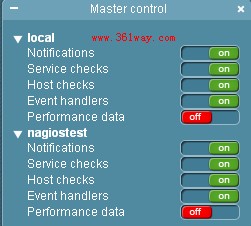
同样在master control块可以方便的控制告警与主机监测等。
总结:这里的Multisite与另一个软件 ———— Centreon所做的事情很类似 。如果从广义的范畴来讲,称其为分布式监控也未尝不可。
参考页面:IT帮 (台湾站点,需翻墙)
如果报错:Cannot connect to event daemon via /usr/local/nagios/var/rw/mkeventd/status: [Errno 2] No such file or directory ,需要启动mkeventd服务。
1#/etc/init.d/mkeventd start
2#chkconfig --add mkeventd
捐赠本站(Donate)
 如您感觉文章有用,可扫码捐赠本站!(If the article useful, you can scan the QR code to donate))
- Author: shisekong
- Link: https://blog.361way.com/distributed-monitoring-livestatus-multisite/2904.html
- License: This work is under a 知识共享署名-非商业性使用-禁止演绎 4.0 国际许可协议. Kindly fulfill the requirements of the aforementioned License when adapting or creating a derivative of this work.