gnuplot绘制性能监控图
linux下的用于性能监控出图的工具很多,像rrdtool、cacti(这个也是基于rrdtool的)、pnp4nagios、smoking、rrdtool等。不过前两天在看一个技术站点时又看到了另一个强大的绘图工具gnuplot(跨平台,不仅仅只linux) —— 其不但能绘制系统性能图、还可以很简单的绘制科学计算图、二维图、三维图、立方图等。项目主页为:http://www.gnuplot.info/ 。
一、安装
目前的最新版为4.6.5,这里不再列出源码包的方式进行安装,因为常用的linux系统源里都有该包:
1//centos/redhat等rpm包安装
2yum -y install gnuplot
3//ubuntu/debian等 apt安装
4sudo apt-get install gnuplot
二、使用及示例
gnuplot有两种绘图方式,一种是交互式,一种是直接配置好相关参数直接运行。(这点和python相似)
交互式方式的如果想直接将图形展示,需要x11终端支持。这里不再具体示例,有兴趣的可以参看gnuplot中文手册参看示例或官方示例。下面以结合第二种方式为例,展示一个完整的示例:
例1、gnuplot绘制CPU使用图
sar获取 cpu信息并输出到文件
1sar -u 1 10 | head -n -2 | tail -11 | grep . > /var/www/html/monitor.data
文件内容格式如下:
 1#cat monitor.data
 206:24:52      CPU     %user     %nice   %system   %iowait    %steal     %idle
 306:24:53      all      0.00      0.00      1.00      1.00      0.00     98.00
 406:24:54      all      0.00      0.00      1.01      0.00      0.00     98.99
 506:24:55      all      5.00      0.00      2.00      0.00      0.00     93.00
 606:24:56      all      1.00      0.00      2.00      6.00      0.00     91.00
 706:24:57      all      0.00      0.00      1.02      2.04      0.00     96.94
 806:24:58      all     31.68      0.00      9.90      0.00      0.00     58.42
 906:24:59      all     76.77      0.00     23.23      0.00      0.00      0.00
1006:25:00      all     73.00      0.00     27.00      0.00      0.00      0.00
1106:25:01      all     76.00      0.00     24.00      0.00      0.00      0.00
编辑monitor.conf配置文件,以备gnuplot读取执行:
1# cat monitor.conf
2set term png
3set xdata time
4set style data lines
5set output 'cpu.png'
6set timefmt '%H:%M:%S'
7set format x '%H:%M:%S'
8set xlabel 'TIME'
9set ylabel 'CPU'
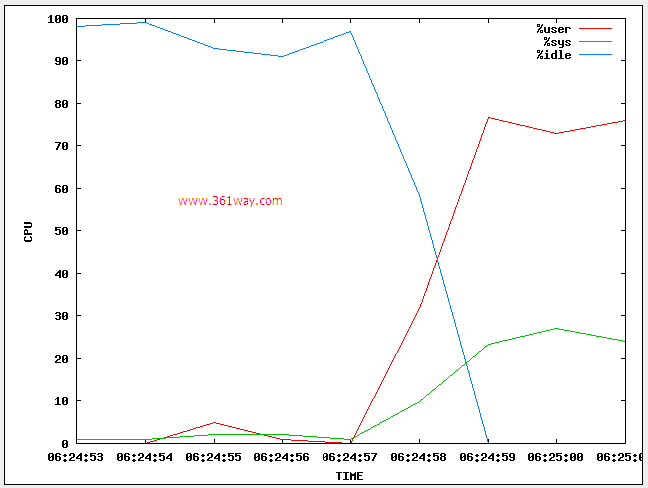
10plot 'monitor.data' using 1:3 title "%user", 'monitor.data' using 1:5 title "%sys", 'monitor.data' using 1:8 title "%idle"
具体输出的图形如下:
可以写一个脚本每隔一分钟执行一次:
1# cat checkcpu.sh
2#!/bin/sh
3sar -u 1 10 | head -n -2 | tail -11 | grep . > /var/www/html/monitor.data && gnuplot  /var/www/html/monitor.conf [root@oracle html]# chmod +x checkcpu.sh
可以再配合一个简单的html页面,每一秒钟刷新一次,html内容如下:
 1<tablewidth>
 2<tr>
 3<td><strong><center>CPU Monitor</center></strong></td>
 4</tr>
 5
 6<br></br>
 7<imgsrc>
 8
 9<scriptlanguage>
10    function refresh(){
11        window.location.reload();
12}
13    setTimeout('refresh()',1000);
14
15</scriptlanguage></imgsrc></tablewidth>
例2、gnuplot绘制负载图
1[root@localhost~]# cat /opt/cpuload.gnuplot
2#!/bin/bash
3uptime | awk ‘{print $1,$(NF-2),$(NF-1),$(NF) }’ | tr -d ‘,’ >>/opt/mydata
4gnuplot <<eof average="" eof="" font="" format="" lines="" output="" plot="" png="" rotate="" set="" t="" terminal="" time="" timefmt="" tiny="" u="" with="" x="" xdata="" xlabel="" xtics="" ylabel="">`<br />````
5<pre class="prettyprint linenums lang-html">[root@localhost ~]# cat /var/www/html/gnuplot.html
6
7<h1>Performance Charts</h1>
8<a href="/loadavg.png">LOAD Acerage</a>
以上脚本也可以利用crontab进行绘图。
当然如果想自制监控平台的话,还可以配合php、mysql等进行入库与图形展示。这里也只是列了两个小示例,gnuplot的使用场景不止这些。
利用apache做压力测试时,也可以用其配合,直接的以图形展示。这里有csdn上的一个示例。
同样,利用tpcc-mysql做mysql性能测试时,也可以利用gnuplot进行绘制性能图。这里有chinaunix上的一个示例。
捐赠本站(Donate)
 如您感觉文章有用,可扫码捐赠本站!(If the article useful, you can scan the QR code to donate))
- Author: shisekong
- Link: https://blog.361way.com/gnuplot-monitoring-chart/3129.html
- License: This work is under a 知识共享署名-非商业性使用-禁止演绎 4.0 国际许可协议. Kindly fulfill the requirements of the aforementioned License when adapting or creating a derivative of this work.