使用graphviz画图
Graphviz是大名鼎鼎的贝尔实验室的几位牛人开发的一个画图工具。它的理念和一般的“所见即所得”的画图工具不一样,是“所想即所得”。 Graphviz提供了dot语言来编写绘图脚本。
一、安装
graphviz可以使用在windows上,也可以使用在linux和MAC上,在centos上只需要一条指令yum install graphviz 即可完成安装。其他OS上的安装可以参考官方文档。
二、使用
1、简单示例
一个简单的示例如下(其实可以再简单点,直接hello -> world):
1# vim text.dot
2digraph G {
3        hello [shape=box];
4        world [style=filled, color="1,1,1"];
5        hello -> world [label="Yes"];
6    }
编译时输出格式可以根据自己的需要来灵活选择,主要有一下三种:
1dot -Tpng test.dot -o test.png
2dot -Tsvg test.dot -o test.svg
3dot test.dot -Tpdf -o test.pdf
2、有向无向图
简单介绍下DOT语言的语法,根据输出图片的是否有箭头指向,会有有向图和无向图的区分,如下:
 1无向图:
 2graph graphname {
 3     a -- b -- c;
 4     b -- d;
 5 }
 6有向图:
 7digraph graphname {
 8     a -> b -> c;
 9     b -> d;
10 }
注:双向图可以使用dir = “both” 解决,代码如下:
1digraph graphName {
2A->B[dir="both"]
3}
3、节点和边的属性设置
边和节点的属性设置方法不一致,节点的属性被放置在只包含节点名称的表达式后,如下:
1digraph G {
2        hello [shape=box];//设置节点属性
3        world [style=filled, color="1,1,1"];//节点多个属性用逗号分开
4        hello -> world [label="Yes"];//设置边的属性
5    }
4、节点和属性总结
画图时需要对图片做一些特别的处理,例如加粗、把图变色等。我们要控制这些东西,就需要用到属性。属性有四种:
- 用在节点上(Node, N) ;
- 用在线段上(Edge, E);
- 用在根图片上(Graph, G);
- 用在子图片上(Cluster subgraph, C)
对于节点(node) 的属性,有以下几种指定法:
- 节点名[节点属性名=值];
- 节点名[节点属性名=值,节点属性名=值];
- node [节点属性名=值,节点属性名=值];
属性指定的语句必须要被中括号括起。当一次指定多值时,需用英文逗点隔开。第三行中的node 是个关键字,用来代称「图片范围内」所有「还没创建」的节点,或者您也可将它理解为:在当前大括号的范围内,所有尚未创建节点的属性预设值,会被这个语句给变更。
对于线段(edge)的属性指定,与上述节点属性指定方式很类似:
- 节点名->节点名[线段属性名=值];
- 节点名–节点名[线段属性名=值,线段属性名=值];
- edge [线段属性名=值,线段属性名=值]; 其中edge 是关键字。
5、子图
subgraph 的作用主要有 3 个:
- 表示图的结构,对节点和边进行分组
- 提供一个单独的上下位文设置属性
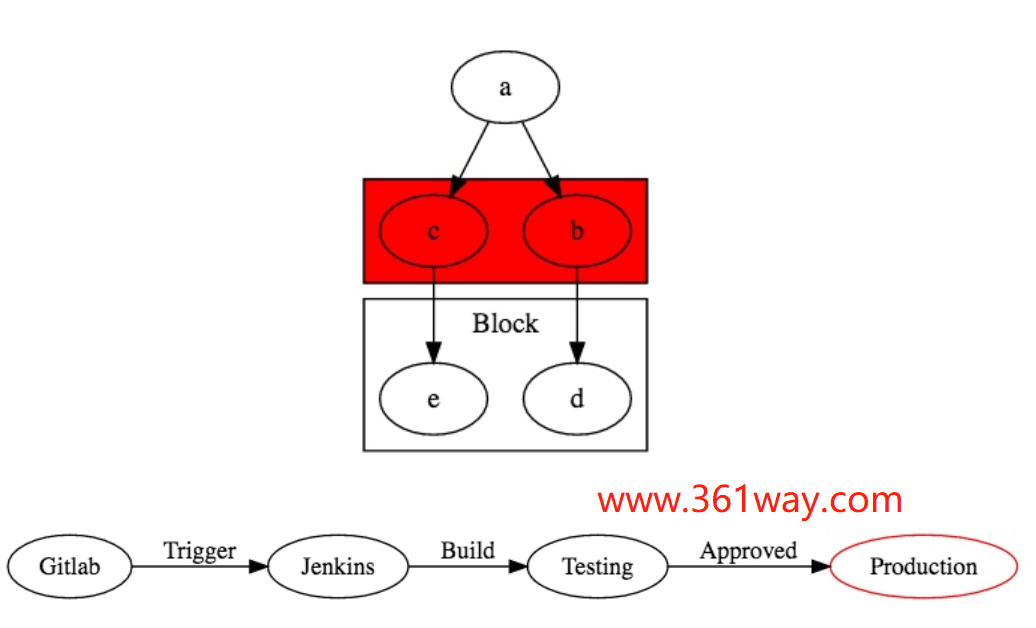
- 针对特定引擎使用特殊的布局。比如下面的例子,如果 subgraph 的名字以 cluster 开头,所有属于这个子图的节点会用一个矩形和其他节点分开。
 1digraph graphname{
 2    a -> {b c};
 3    c -> e;
 4    b -> d;
 5    subgraph cluster_bc {
 6        bgcolor=red;
 7        b;
 8        c;
 9    }
10    subgraph cluster_de {
11        label="Block"
12        d;
13        e;
14    }
15}
6、布局
默认情况下图是从上到下布局的,通过设置 rankdir=“LR” 可以让图从左到右布局,对应的也有从上到下的布局为 rankdir=“TB”。
一个简单的表示 CI/CD 过程的图:
 1digraph pipleline {
 2    rankdir=LR;
 3    g [label="Gitlab"];
 4    j [label="Jenkins"];
 5    t [label="Testing"];
 6    p [label="Production" color=red];
 7    g -> j [label="Trigger"];
 8    j -> t [label="Build"];
 9    t -> p [label="Approved"];
10}
三、一些demo示例
1、进程内部模块调用示例
 1digraph G{
 2    size = "5, 5";//图片大小
 3    main[shape=box];/*形状*/
 4    main->parse;
 5    parse->execute;
 6    main->init[style = dotted];//虚线
 7    main->cleanup;
 8    edge[color = green]; // 连接线的颜色
 9    execute->{make_string; printf}//连接两个
10    init->make_string;
11    main->printf[style=bold, label="100 times"];//线的 label
12    make_string[label = "make a\nstring"]// \n, 这个node的label,注意和上一行的区别
13    node[shape = box, style = filled, color = ".7.3 1.0"];//一个node的属性
14    execute->compare;
15}
2、游戏资源更新流程
 1digraph startgame {
 2    label="游戏资源更新流程"
 3    rankdir="TB"
 4    start[label="启动游戏" shape=circle style=filled]
 5    ifwifi[label="网络环境判断是否 WIFI" shape=diamond]
 6    needupdate[label="是否有资源需要更新" shape=diamond]
 7    startslientdl[label="静默下载" shape=box]
 8    enterhall[label="进入游戏大厅" shape=box]
 9    enterroom[label="进入房间" shape=box]
10    resourceuptodate[label="资源不完整" shape=diamond]
11    startplay[label="正常游戏" shape=circle fillcolor=blue]
12    warning[label="提醒玩家是否更新" shape=diamond]
13    startdl[label="进入下载界面" shape=box]
14    //{rank=same; needupdate, enterhall}
15    {shape=diamond; ifwifi, needupdate}
16    start -> ifwifi
17    ifwifi->needupdate[label="是"]
18    ifwifi->enterhall[label="否"]
19    needupdate->startslientdl[label="是"]
20    startslientdl->enterhall
21    needupdate->enterhall[label="否"]
22    enterhall -> enterroom
23    enterroom -> resourceuptodate
24    resourceuptodate -> warning[label="是"]
25    resourceuptodate -> startplay[label="否"]
26    warning -> startdl[label="确认下载"]
27    warning -> enterhall[label="取消下载"]
28    startdl -> enterhall[label="取消下载"]
29    startdl -> startplay[label="下载完成"]
30}
3、生成有颜色和形状的图表
1digraph example3 {
2    Server1 -> Server2
3    Server2 -> Server3
4    Server3 -> Server1
5    Server1 [shape=box, label="Server1\nWeb Server", fillcolor="#ABACBA", style=filled]
6    Server2 [shape=triangle, label="Server2\nApp Server", fillcolor="#DDBCBC", style=filled]
7    Server3 [shape=circle, label="Server3\nDatabase Server", fillcolor="#FFAA22", style=filled]
8}
4、字节点调用图
 1graph G{
 2"黑海" [shape = circle, color = blueviolet, fontcolor = blueviolet, fontsize = 20];
 3"黑海" -- "亚速海" [label = "刻赤海峡"];
 4subgraph cluster_T{
 5label = "黑海海峡";
 6fontsize = 24;
 7fillcolor = darkslategray;
 8style = filled;
 9fontcolor = white;
10node [fontcolor = white, color = white];
11"博斯普鲁斯海峡" -- "马尔马拉海" -- "达达尼尔海峡" [color = white];
12"博斯普鲁斯海峡" [shape = parallelogram];
13"达达尼尔海峡" [shape = parallelogram];
14}
15"黑海" -- "博斯普鲁斯海峡" [color = red ,penwidth = 2];
16"达达尼尔海峡" -- "爱琴海" [color = red ,penwidth = 2];
17subgraph cluster_M{
18label = "地中海海域";
19fontsize = 24;
20"西部地中海" [shape = Mcircle, style = filled, color = grey, fillcolor = aquamarine, fontsize = 20];
21"中部地中海" [shape = Mcircle, style = filled, color = grey, fillcolor = aquamarine, fontsize = 20];
22"直布罗陀海峡" [shape = parallelogram, fontcolor = red];
23"西西里海峡" [shape = parallelogram ];
24"中部地中海" -- {"爱琴海" "爱奥尼亚海" "西西里海峡"};
25"西部地中海" -- {"西西里海峡" "第勒安海" "利古里亚海" "伊比利海" "阿尔沃兰海"};
26"爱奥尼亚海" -- "亚得里亚海"; 30 "阿尔沃兰海" -- "直布罗陀海峡";
27}
28}
5、python模块调用示例
 1import pygraphviz as pgv
 2G = pgv.AGraph(directed=True, rankdir="TB")
 3# 设置节点标签
 4Root = "道路交通流畅"
 5negative_1 = "平均延误时间"
 6negative_2 = "负荷度"
 7negative_3 = "小区位置"
 8negative_4 = "相对延误率"
 9negative_5 = "房屋密度"
10negative_6 = "人口密度"
11negative_7 = "总延误率"
12negative_8 = "排队率"
13negative_9 = "行驶时间"
14positive_1 = "通行能力"
15positive_2 = "公路层级"
16positive_3 = "路网结构"
17positive_4 = "行驶速度"
18positive_5 = "路网长度"
19positive_6 = "小区面积"
20positive_7 = "内部道路密度"
21positive_8 = "路网密度"
22# 添加节点
23G.add_node(Root, style="filled", shape="box3d", color="#feb64d")
24for negative in [eval(_) for _ in dir() if _.startswith("negative")]:
25    G.add_node(negative, style="filled", shape="ellipse", color="#CFDBF6")
26for positive in [eval(_) for _ in dir() if _.startswith("positive")]:
27    G.add_node(positive, style="filled", shape="ellipse", color="#B4E7B7")
28# 添加边
29G.add_edges_from([[Root, negative_1], [Root, negative_6], [Root, negative_8], [Root, negative_9],
30                  [negative_1, negative_2], [negative_1, negative_7], [negative_2, negative_3],
31                  [negative_2, negative_7], [negative_3, negative_4], [negative_8, negative_9],
32                  [positive_2, negative_5], [positive_3, negative_4], [positive_4, negative_5]],
33                 color="#B4DBFF", style="dashed", penwidth=1.5)
34G.add_edges_from([[Root, positive_1], [Root, positive_8], [negative_5, negative_4],
35                  [negative_6, positive_4], [negative_5, positive_4], [negative_9, positive_5],
36                  [positive_1, positive_2], [positive_2, positive_3], [positive_6, positive_5],
37                  [positive_7, positive_6], [positive_8, positive_7]],
38                 color="#B4E7B7", style="dashed", penwidth=1.5)
39# 导出图形
40G.layout()
41G.draw("因子相关性图.png", prog="dot")
6、结构体切割
 1digraph dfd2{
 2        node[shape=record]
 3        subgraph level0{
 4        enti1 [label="Customer" shape=box];
 5        enti2 [label="Manager" shape=box];
 6        }
 7        subgraph cluster_level1{
 8                        label ="Level 1";
 9                        proc1 [label="{<f0> 1.0|<f1> One process here\n\n\n}" shape=Mrecord];
10                        proc2 [label="{<f0> 2.0|<f1> Other process here\n\n\n}" shape=Mrecord];
11                        store1 [label="<f0>    |<f1> Data store one"];
12                        store2 [label="<f0>   |<f1> Data store two"];
13            {rank=same; store1, store2}
14        }
15        enti1 -> proc1
16        enti2 -> proc2
17        store1 -> proc1
18        store2 -> proc2
19    proc1 -> store2
20    store2 -> proc1
21}</f1></f0></f1></f0></f1></f0></f1></f0>
捐赠本站(Donate)
 如您感觉文章有用,可扫码捐赠本站!(If the article useful, you can scan the QR code to donate))
- Author: shisekong
- Link: https://blog.361way.com/graphviz/6503.html
- License: This work is under a 知识共享署名-非商业性使用-禁止演绎 4.0 国际许可协议. Kindly fulfill the requirements of the aforementioned License when adapting or creating a derivative of this work.