华为云日志如何集成到splunk cloud(一)规划篇
一、背景
splunkcloud 是一个比较优秀的AIOPS集成分析平台。所以经常会遇到客户需要把数据发往其平台进行集成的情况,尤其在多云场景下。这里就以华为云的操作审计日志为例,规划下如何将数据发送给splunkcloud。
二、数据发送到splunk cloud的方式
下图是根据splunkcloud的官方文档提供的方式总结的数据发往splunk cloud的几种方式。
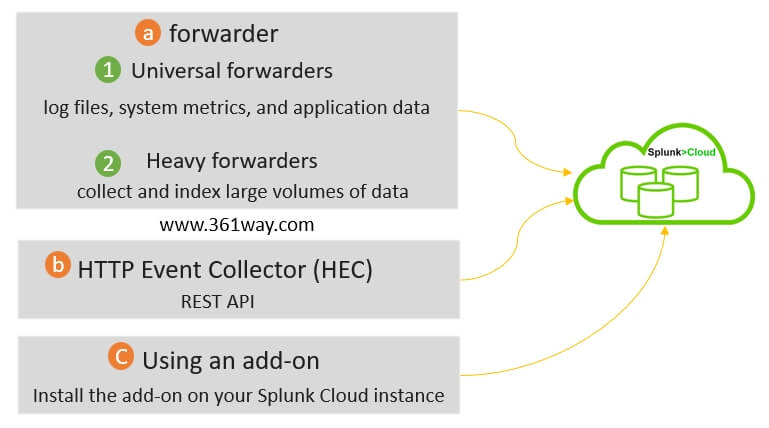
1. forwarder方式
这种方式需要有台主机,这台主机可以连外网,通过在主机上安装Agent并启动服务,然后指定对应的需要采集的文件的位置,就可以发往splunk cloud平台。forwarder方式也分为Universal forwarders和Heavy forwarders。
- Universal forwarders are the most common type of forwarder and can be used to collect data from a wide range of sources, including log files, system metrics, and application data.
- Heavy forwarders are designed to collect and index large volumes of data.
具体步骤如下:
- Install the forwarder on the machine where you want to collect data from.
- Configure the forwarder to send data to your Splunk Cloud instance.
- Create inputs on the forwarder to specify the sources of the data that you want to collect.
2. HEC方式
Using the HTTP Event Collector (HEC): HEC is a REST API that allows you to send data to Splunk Cloud in real time. HEC is a good option for sending data from applications and devices that cannot use a forwarder.To send data to Splunk Cloud using HEC, you will need to:
- Make a POST request to the HEC endpoint with your data.
- Include your Splunk Cloud HEC token in the request header.
在无服务器场景下经常会使用该方式,比如AWS lambda、Huaweicloud Functiongraph就可以很方便的通过该方式集成。
3. 插件方式
Using an add-on: An add-on is a software package that extends the functionality of Splunk Cloud. There are many add-ons available that can be used to collect data from specific sources and send it to Splunk Cloud.To send data to Splunk Cloud using an add-on, you will need to:
- Install the add-on on your Splunk Cloud instance.
- Configure the add-on to collect data from the desired source.
- Deploy the add-on to the forwarders that you want to collect data from.
插件方式是和第一种方式结合的,只不过可以更方便我们采集一些数据。
三、华为云CTS日志和splunk cloud集成的选择
回到最初的话题,我们如何把云上的审计日志(操作记录)发送到 splunk cloud。见下图,我这里也列了三个方式去实现。
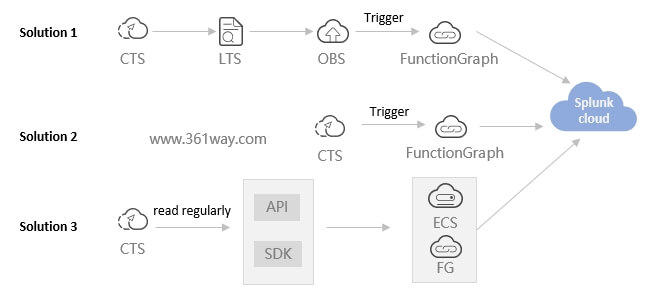
1、方案2
先看方案2 在FunctionGraph里配置CTS触发器,当相关的CTS事件触发时,直接把相关的日志发送到splunkcloud。这条路径看起来最短而且也最直接。但在执行时确会有问题。
- 不是每个Region上的FunctionGraph都支持CTS触发器;
- 其最多支持10个云服务的100个operations操作,这个限制就比较局限了,比如监听了主机开关机,可能就触发不了网卡调整或硬盘调整。
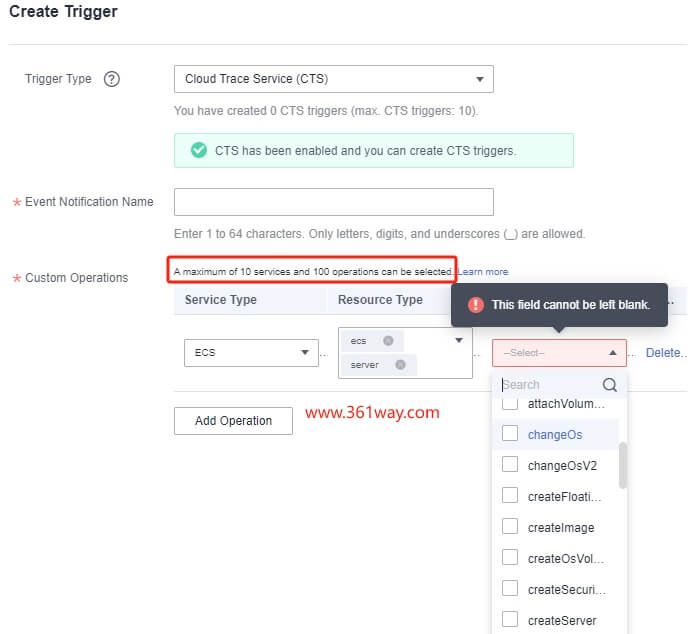
所以该方式比较适合收集特定操作的情况。
2、方案3
通过API或SDK读取CTS的日志,再通过ECS上的forwarder方式 或 FunctionGraph调用HEC方式向splunk cloud push/post数据。这个方案路径也比较短。不过看下官方API文档会发现如下问题。
Number of traces to query. The default value is 10 and the maximum value is 200.
通过API调用单次最多调有200条审计日志,这里两种假设:一种是用户比较少只有一个;另一种是通过IAM配置,主帐号下面有几百上千个子帐号。
- 前一种很可能要处理数据去重,是不是每次调用返回的结果都和下一次的结果里有几十条数据是重叠的;
- 后一种可能会数据读取不及时,如果多人同时操作,每秒产生1000条审计日志,而我们程序每秒读取200条,是不是就有800条数据不能及时读到。
该方案比较适合对数据集中一个时间段下载后,通过操作后(如:去重),然后统一上传的场景。
3、方案1
CTS日志默认是保存最近7天的,日志轮转到OBS后,可以配置策略决定在OBS里存储的时间长短。另外CTS保存在OBS里的日志是会根据天、服务名称方式进行区分的,最后会保存成json.gz的多个文件。这个方案的优势如下:
- LTS 服务是类似于 ELK 的服务,可以直接在云平台读取OBS里的数据进行检索和查询,这样多一个数据及时查询的平台;
- OBS本身是比较便宜的,可以决定在OBS里存储审计日志信息的长短;
- FunctionGraph本身是可以弹性的,在审计日志短时间较多时也可以很好的去处理。而且其是根据调用次数收费的,平时不调用的时候不计费。
捐赠本站(Donate)
 如您感觉文章有用,可扫码捐赠本站!(If the article useful, you can scan the QR code to donate))
- Author: shisekong
- Link: https://blog.361way.com/huaweicloud-cts-splunkcloud/8990.html
- License: This work is under a 知识共享署名-非商业性使用-禁止演绎 4.0 国际许可协议. Kindly fulfill the requirements of the aforementioned License when adapting or creating a derivative of this work.