python matplotlib画饼图
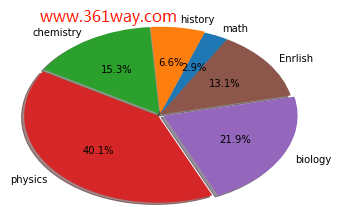
画饼画使用的方法是plt.pie方法,里面有几个参数可以设置,具体后面再提,先看下代码和效果。这里以常见的几个课目的值为例,算下各个科目在饼图中占的比重。
1import matplotlib.pyplot as plt
2x = [4, 9, 21, 55, 30, 18]
3labels = ['math', 'history', 'chemistry', 'physics', 'biology','Enrlish']
4explode = [0, 0.01, 0.01, 0.02, 0.03, 0]
5plt.pie(x, labels=labels, explode=explode,shadow=True,autopct='%1.1f%%',startangle=60,radius=1)
6plt.show()
7plt.close()
上面的代码在 jupyter notebooks 中是直接画不出图的,会提示 ,原因是需要在启动时需要指定inline参数,也可以在代码最前面加下%matplotlib inline 解决,具体执行后结果如下图:
上面使用几个参数的意思如下:
 1labels  (每一块)饼图外侧显示的说明文字
 2explode (每一块)离开中心距离
 3startangle  起始绘制角度,默认图是从x轴正方向逆时针画起,如设定=90则从y轴正方向画起
 4shadow  是否阴影
 5labeldistance label绘制位置,相对于半径的比例, 如<1则绘制在饼图内侧
 6autopct 控制饼图内百分比设置,可以使用format字符串或者format function。'%1.1f'指小数点前后位数(没有用空格补齐)
 7pctdistance 类似于labeldistance,指定autopct的位置刻度
 8radius  控制饼图半径
 9返回值:
10如果没有设置autopct,返回(patches, texts)
11如果设置autopct,返回(patches, texts, autotexts
捐赠本站(Donate)
 如您感觉文章有用,可扫码捐赠本站!(If the article useful, you can scan the QR code to donate))
- Author: shisekong
- Link: https://blog.361way.com/matplotlib-pie/6167.html
- License: This work is under a 知识共享署名-非商业性使用-禁止演绎 4.0 国际许可协议. Kindly fulfill the requirements of the aforementioned License when adapting or creating a derivative of this work.
